Global AI in Oil and Gas Market Research Report – Segmentation By Component (Solution, Services), By Technology (Machine Learning, Natural Language Processing (NLP), and Computer Vision ), By Application (Upstream, Midstream, and Downstream ), and By Region (North America, Europe, Asia Pacific, Latin America, and Middle East - Africa) – Industry Forecast 2025 to 2033
Global AI in Oil and Gas Market Size
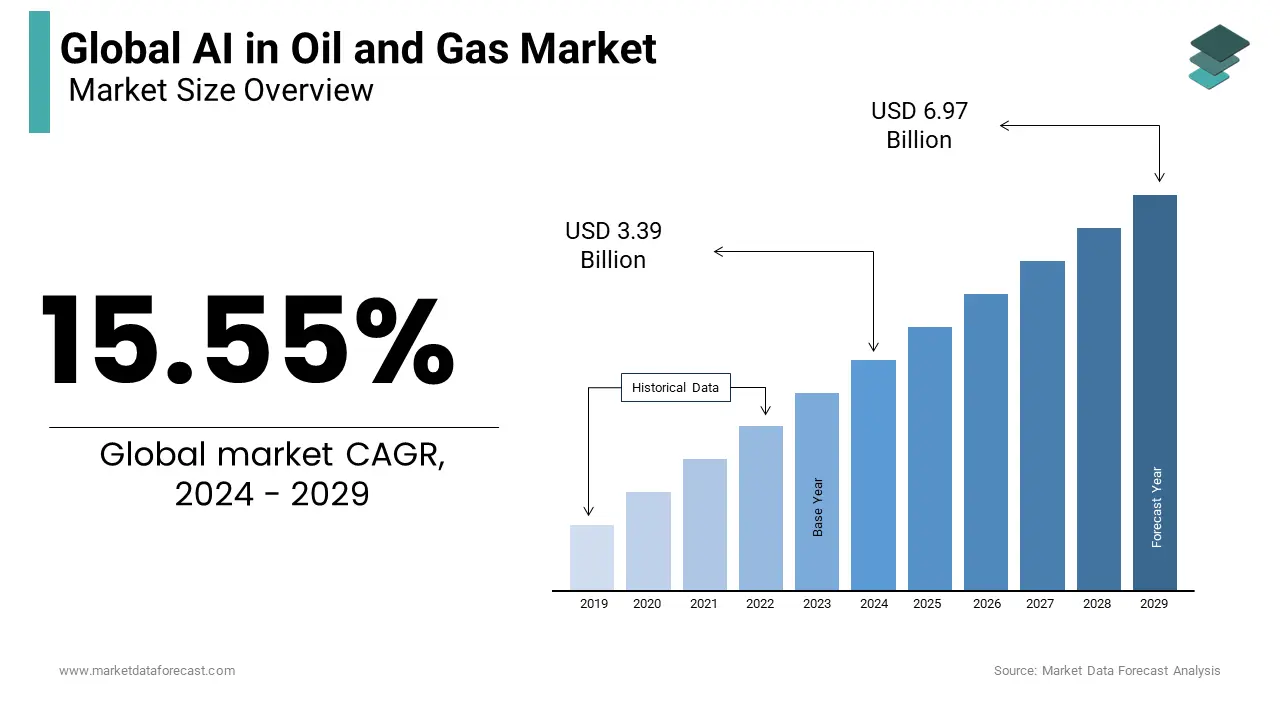
The Global AI in oil and gas market was valued at USD 4.37 billion in 2025 and is expected to reach a valuation of USD 15.99 billion by 2034 from USD 5.05 billion in 2026, registering a CAGR of 15.55% during the forecast period 2026 to 2034.
Artificial Intelligence in oil and gas is the deployment of machine learning, computer vision, natural language processing, and predictive analytics to optimize exploration, drilling, production, maintenance, and safety across upstream, midstream, and downstream operations. Unlike generic enterprise AI, its value lies in interpreting subsurface geophysics, predicting equipment failure under extreme pressure-temperature regimes, and automating hazardous field inspections, tasks where human error or latency carries catastrophic risk.
MARKET DRIVERS
Escalating Regulatory and Safety Mandates Requiring Predictive Risk Mitigation
Global regulators are mandating AI-powered predictive maintenance and real-time anomaly detection to prevent spills, blowouts, and fugitive emissions, transforming AI from an efficiency tool to a compliance necessity, which is propelling the growth of AI in oil and gas market. The pipeline integrity violations involved failure to detect precursor anomalies, a gap expected to close by AI models analyzing inline inspection (ILI) tool data with notable accuracy. According to research, offshore operators deploy AI-based wellhead monitoring systems, which reduces unplanned shutdowns in pilot fields. This regulatory gravity compels adoption irrespective of ROI, which makes AI a non-discretionary layer in operational governance.
Depletion of Conventional Reserves Demanding AI-Optimized Enhanced Recovery and Subsurface Imaging
Depletion of conventional reserves demanding ai-optimized enhanced recovery and subsurface imaging boosts the growth rate of the AI in oil and gas market. As easily accessible reserves dwindle, operators must extract hydrocarbons from complex, low-permeability, or mature fields. It is a challenge only addressable through AI-enhanced reservoir modeling and real-time drilling optimization. As per the study, a percentage of new production through 2030 will come from enhanced oil recovery (EOR) and unconventional plays, reservoirs requiring dynamic, and AI-adjusted injection patterns. Saudi Aramco’s Ghawar field optimization used deep learning to reinterpret 4D seismic data, which increases recovery factor and adds billions of barrels of reserves.
MARKET RESTRAINTS
Legacy Infrastructure Incompatibility and Data Silos Blocking AI Integration
Most oil and gas assets operate on decades-old SCADA systems, proprietary historian databases, and analog sensor networks, which creates data latency and format fragmentation that cripple AI model training, restricting the growth of the AI in oil and gas market. A percentage of upstream operators report that a smaller share of field sensor data is usable for AI due to protocol mismatches or missing timestamps. Moreover, implementing AI in healthcare faces significant challenges related to data quality, normalization, and integration, mirroring the substantial time and cost Chevron incurred to prepare legacy data for its Permian digital twin.
Cybersecurity Vulnerabilities in Edge-AI Deployments on Important Infrastructure
Deploying AI at the edge, on rigs, pipelines, or refineries, exposes operational technology (OT) networks to adversarial attacks that can manipulate sensor inputs or disable safety shutdowns, which hampers the expansion of the AI in oil and gas market. The l and gas AI pilot projects failed penetration testing due to unpatched Linux kernels on edge gateways. AI systems are yet to achieve ISA/IEC 62443-4-2 certification for OT resilience as operators face a paradox. The more intelligent the system, the greater the attack surface, which throttles adoption in safety-essential domains.
MARKET OPPORTUNITIES
Autonomous Field Operations via AI-Driven Robotics and Digital Twins
AI is enabling fully autonomous well pads, pipelines, and offshore platforms is one of the major factors contributing to the new opportunities for the AI in oil and gas market. It is where digital twins simulate interventions, and robots execute inspections, valve operations, and leak repairs without human presence. As per study, AI-coordinated drones and crawlers reduced manned inspection hours, which cuts HSE risk exposure by notable personnel-hours annually. Shell was seen as a leader in applying AI to improve efficiency and reduce flaring in the Permian. This shift from human-in-the-loop to AI-in-command unlocks operations in extreme environments, Arctic, deepwater, and conflict zones, where labor is unavailable or unsafe.
AI-Optimized Carbon Capture and Methane Abatement for ESG Compliance
AI is becoming the central nervous system for decarbonization, like predicting compressor efficiency for CO₂ reinjection, detecting fugitive methane with satellite-ML fusion, and optimizing solvent regeneration in CCUS trains, which provides new opportunities for AI in the oil and gas market growth. As per the study, many nations target methane reduction by 2030, a goal unattainable without AI. In 2023, ExxonMobil partnered with Scepter and Amazon Web Services (AWS) to develop a comprehensive, data-analytics platform.
MARKET CHALLENGES
Lack of Standardized AI Validation Protocols for Safety-essential Decision Systems
The absence of standardized ai validation protocols for safety-essential decision systems challenges the expansion of the AI in oil and gas market. Unlike pharmaceuticals or aviation, no global body certifies AI models for well control, pipeline integrity, or flare gas management, which creates liability ambiguity when algorithms fail. As per the study, only a portion of AI-based drilling advisory systems have undergone third-party validation, the rest rely on vendor black-box claims.
Workforce Capability Gap in Interpreting and Trusting AI Recommendations
Field engineers and geoscientists often reject AI outputs due to lack of explainability, domain misalignment, or cultural resistance, which degrades the growth rate of the AI in oil and gas market. This hampers deployment even when technically sound. As per the study, a portion of reservoir engineers distrust black-box AI models that cannot articulate why a drilling parameter was adjusted. According to study, a percentage of its AI-generated frac designs were overridden by field supervisors due to lack of geological intuition. Saudi Aramco is a leader in AI adoption, investing heavily in making it a core part of its operations and viewing it as central to future success.
REPORT COVERAGE
| REPORT METRIC | DETAILS |
| Market Size Available | 2025 to 2034 |
| Base Year | 2025 |
| Forecast Period | 2026 to 2034 |
| Segments Covered | By Type, Voltage Range, End Use, and Region. |
| Various Analyses Covered | Global, Regional, & Country Level Analysis; Segment-Level Analysis, Drivers, Restraints, Opportunities, Challenges, PESTLE Analysis, Porter’s Five Forces Analysis, Competitive Landscape, Analyst Overview of Investment Opportunities |
| Regions Covered | North America, Europe, Asia Pacific, Latin America, Middle East, and Africa |
| Key Market Players | IBM Corporation, Accenture PLC, Baker Hughes (a GE Company), C3.ai, Microsoft Corporation, NVIDIA Corporation, Hewlett Packard Enterprise (HPE), Schlumberger Limited, Halliburton Company, Oracle Corporation, and Others. |
SEGMENTAL ANALYSIS
By Component Insights
The solutions segment dominated the AI in oil and gas market by capturing a substantial share in 2025 with the operators prioritizing embedded intelligence over advisory services for mission-essential, and real-time decision-making. The offshore operators deploy AI-based well integrity monitoring solutions as mandated by API RP 75, which reduces unplanned shutdowns. Services offer episodic insights. In contrast, solutions embed AI into a company's operational DNA. This enables autonomous continuous optimization that is aligned with safety and production KPIs.
The AI services segment is expected to grow with an expected CAGR of 28.9% from 2026 to 2034 due to the acute shortage of in-house AI talent and the complexity of integrating AI into legacy OT environments. Only a share of upstream engineers possess the skills to train or validate domain-specific AI models, which forces reliance on Accenture, SLB, and Baker Hughes for model deployment. In India, ONGC's Institute of Petroleum Exploration & Oilfield Technology (IPEOT) is developing AI/ML-powered simulation models for process optimization, predictive maintenance, and real-time decision-making.
By Technology Insights
The machine learning segment led the AI in the oil and gas market by accounting for 58.7% of share in 2025. The growth of the machine learning segment is driven by the factor that it directly addresses the sector’s core challenges. This includes predicting equipment failure under extreme conditions, optimizing recovery from complex reservoirs, and dynamically adjusting operations in real-time. As per the research, a portion of AI-driven production gains due to ML models optimizing choke valves, ESP speeds, and water injection rates, functions unattainable with rules-based systems. Also, ML’s dominance is structural. It transforms static assets into adaptive systems, which makes it indispensable for efficiency, safety, and sustainability.
The computer vision segment is expected to exhibit a noteworthy CAGR of 34.2% from 2026 to 2034 due to its ability to automate hazardous visual inspections, detect fugitive emissions, and guide autonomous robotics in environments where human access is restricted or lethal. As per the study, CV-powered drone inspections are widely adopted in the oil and gas industry due to operational advantages like enhanced safety, improved efficiency, and superior accuracy in defect detection, rather than mandatory regulations.
By Application Insights
The upstream segment was the largest and held 49.3% of the AI in oil and gas market share in 2025 with AI’s highest-value applications, reservoir characterization, drilling optimization, and production forecasting, reside where geological uncertainty and capital intensity are greatest. As per the research, a share of global AI investment targets upstream, where a 1% recovery improvement adds billions in reserves. It is the structural core of value creation in the energy transition era because upstream AI, unlike midstream or downstream, doesn’t just cut costs but unlocks stranded resources.
The midstream segment is predicted to witness the highest CAGR of 31.5% over the forecast period due to regulatory mandates for real-time pipeline integrity monitoring, methane detection, and autonomous inspection, applications where AI delivers compliance and safety simultaneously. The segment’s growth is also driven by environmental regulation, safety enforcement, and asset longevity imperatives that render AI indispensable for license to operate.
REGIONAL ANALYSIS
North America AI in Oil and Gas Market Analysis
North America led the AI in oil and gas market by occupying 38.6% share in 2025, with setting the global standard for AI validation, regulatory enforcement, and workforce upskilling. This makes it the proving ground for mission-essential deployments. The United States representing a share of regional demand. The U.S. funded AI-for-energy projects, including autonomous drilling and CCUS optimization. Canada’s CER requires all operators to implement inline inspection analytics — triggering Enbridge’s $89 million Seeq deployment. There has been a reduction in offshore incidents after mandating AI well monitoring.
Middle East & Africa AI in Oil and Gas Market Analysis
The Middle East was the second-largest in the AI in oil and gas market with 26.4% share in 2025. The state-backed AI-driven reservoir optimization and autonomous field development, where national oil companies treat AI as a strategic reserve-enhancement tool. Saudi Aramco AI investment targets reservoir modeling and autonomous drilling, which adds large number of barrels to Ghawar alone.
Europe AI in Oil and Gas Market Analysis
Europe market is expected to grow owing to regulatory duality, which enforces the strictest AI safety and emissions standards while mandating autonomous operations to reduce human risk. The UK government has adopted a "pro-innovation" approach to AI regulation, utilizing existing regulatory bodies and voluntary principles. The EU Methane Regulation (EU/2024/1787) is a comprehensive framework requiring strict monitoring, reporting, and repair protocols for methane emissions. Europe doesn’t adopt AI despite regulation.
Asia Pacific AI in Oil and Gas Market Analysis
Asia Pacific is growing moderately in the AI in oil and gas market which is driven by NOC modernization mandates, methane regulation, and workforce upskilling initiatives. ONGC utilizes AI/ML for operations and has other partnerships, and TCS has AI-driven projects with other companies like Weatherford and TotalEnergies. China National Petroleum Corporation (CNPC) has implemented an AI-based drilling system called Changlong at a shale oilfield, which has successfully reduced non-productive time.
Latin America AI in Oil and Gas Market Analysis
Latin America is likely to expand in the AI in oil and gas market as AI adoption is concentrated in state-backed megaprojects and regulatory compliance, where national champions deploy AI to extend field life and meet environmental mandates. Brazil and Petrobras utilize AI extensively in oil and gas. Argentina's state-owned energy company, YPF, along with other operators in the Vaca Muerta shale play, has adopted advanced technologies like drones and artificial intelligence (AI) to improve operational efficiency and safety. Drones equipped with sensors and AI-powered analytics are widely used in the oil and gas industry to expedite inspections and detect anomalies, leading to significant time savings.
COMPETITIVE LANDSCAPE
Competition pivots on domain depth, not algorithmic novelty; winners embed AI into reservoir physics, drilling heuristics, and pipeline integrity protocols that generic vendors cannot replicate. Differentiation lies in regulatory pre-certification, OT cybersecurity, and change management, not dashboard aesthetics. Enterprises demand unified platforms that merge seismic, drilling, and emissions data, which rejects siloed point solutions.
KEY MARKET PLAYERS
A few of the major companies in the global AI in oil and gas market include
- IBM Corporation
- Accenture PLC
- Baker Hughes (a GE Company)
- C3.ai
- Microsoft Corporation
- NVIDIA Corporation
- Hewlett Packard Enterprise (HPE)
- Schlumberger Limited
- Halliburton Company
- Oracle Corporation
- Others.
Top Players in the Market
C3 AI
C3 AI delivers enterprise-scale AI applications for predictive maintenance, reservoir optimization, and emissions management across upstream and midstream operations. The company expanded its partnership with Shell to deploy methane detection AI across global basins. C3 AI also integrated with OSIsoft PI and Aveva Historian systems, which enables plug-and-play deployment in brownfield environments without data re-architecture.
Schlumberger (SLB)
SLB embeds AI natively into its drilling, completions, and reservoir management workflows via the DELFI cognitive E&P environment. The firm launched PetroGen AI for unconventional plays by forecasting EUR per frac stage using geomechanical ML. SLB also partnered with Microsoft Azure to offer sovereign-cloud AI for NOCs in the Middle East, which ensures data residency and regulatory compliance.
Halliburton
Halliburton drives AI adoption through its DecisionSpace 365 cloud platform unifying seismic interpretation, drilling automation, and production forecasting. The company integrated computer vision into its FracValve monitoring by detecting sand erosion via edge-AI cameras.
Top Strategies Used by Key Market Participants
Leading players embed AI into domain-specific workflows, not generic platforms, ensuring geological and engineering relevance. They prioritize regulatory-first deployments to meet PHMSA, API, and IEA mandates. Strategic cloud partnerships enable sovereign data hosting for NOCs. Brownfield integration focuses on legacy historian compatibility, not greenfield replacement. Talent development through academies bridges workforce gaps, which transforms AI from a black box to a co-pilot.
RECENT MARKET HAPPENINGS
- In 2022, Baker Hughes expanded its AI offerings, including the BHC3 AI Suite, to provide predictive maintenance and operational optimization solutions. They collaborated with customers to enhance equipment reliability.
- In 2023, C3.ai partnered with oil and gas companies to deploy AI-based applications for asset management, production optimization, and environmental monitoring.
- In 2023, Microsoft Azure continued to be a leading cloud platform for AI solutions in the oil and gas sector. They developed AI applications for reservoir simulation and predictive analytics.
MARKET SEGMENTATION
This research report on the global AI in oil and gas market has been segmented and sub-segmented based on component, technology, application, and region.
By Component
- Solution
- Services
By Technology
- Machine Learning
- Natural Language Processing (NLP)
- Computer Vision
By Application
- Upstream
- Midstream
- Downstream
By Region
- North America
- Europe
- Asia Pacific
- Latin America
- Middle East & Africa
Frequently Asked Questions
1. What is the AI in Oil and Gas Market growth rate during the projection period?
The Global AI in Oil and Gas Market is expected to grow with a CAGR of 15.55% between 2024-2032.
2. What can be the total AI in Oil and Gas Market value?
The Global AI in Oil and Gas Market size is expected to reach a revised size of US$ 10.76 billion by 2032.
3. Name any three AI in Oil and Gas Market key players?
IBM Corporation, Accenture PLC, Baker Hughes (a GE Company), are the three AI in Oil and Gas Market key players.
Related Reports
Access the study in MULTIPLE FORMATS
Purchase options starting from
$ 2500
Didn’t find what you’re looking for?
TALK TO OUR ANALYST TEAM
Need something within your budget?
NO WORRIES! WE GOT YOU COVERED!
Call us on: +1 888 702 9696 (U.S Toll Free)
Write to us: sales@marketdataforecast.com