Asia Pacific Advanced Visualization Market Research Report – Segmented By Product & Services (Hardware, Software, Services), Solution, Imaging Modality, Clinical Application, End-User & By Country (India, China, Japan, South Korea, Australia, New Zealand, Thailand, Malaysia, Vietnam, Philippines, Indonesia, Singapore & Rest of APAC) - Industry Analysis From 2026 to 2034
Market Size, 2025
$0.53 BnMarket Estimate, 2026
$0.60 BnMarket Forecast, 2034
$1.60 BnCAGR, 2026–2034
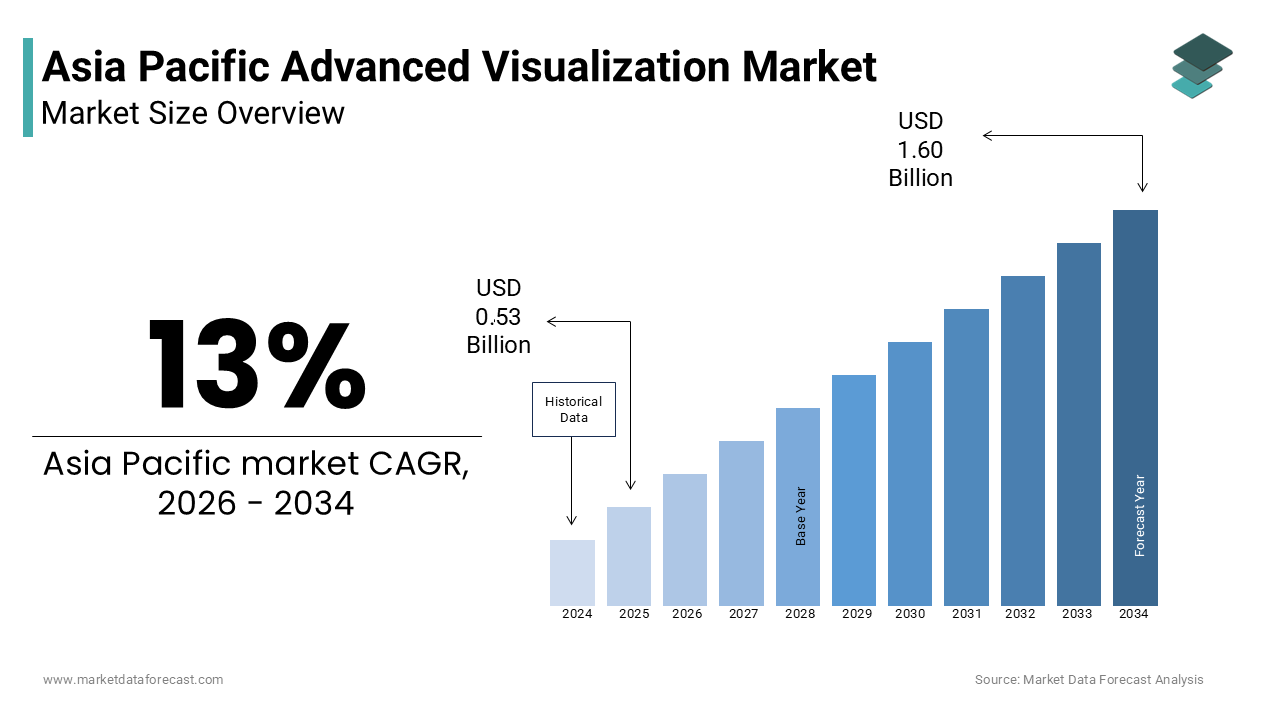
13.0%Asia Pacific Advanced Visualization Market Report Summary
The Asia Pacific advanced visualization market was valued at USD 0.53 billion in 2025 and is anticipated to reach USD 0.60 billion in 2026 from USD 1.60 billion by 2034, growing at a CAGR of 13.0% during the forecast period from 2026 to 2034. The growth of the Asia Pacific advanced visualization market is driven by the rising prevalence of chronic diseases, increasing adoption of precision medicine, and rapid digital transformation across healthcare and industrial sectors. Growing investments in advanced medical imaging technologies, expanding implementation of Industry 4.0 initiatives, and increasing demand for real-time data visualization and analytics are further accelerating market growth. Moreover, the integration of artificial intelligence and machine learning with visualization platforms, expanding smart city projects, and growing adoption of cloud-based visualization solutions are supporting the expansion of the Asia Pacific advanced visualization market.
Key Market Trends
-
Rising integration of artificial intelligence and machine learning with advanced visualization platforms.
-
Increasing adoption of cloud-based visualization software for healthcare and industrial applications.
-
Growing deployment of digital twin technologies across manufacturing and smart infrastructure projects.
-
Rising utilization of advanced visualization in precision medicine and surgical planning.
-
Increasing adoption of visualization technologies in smart city development and precision agriculture.
Segmental Insights
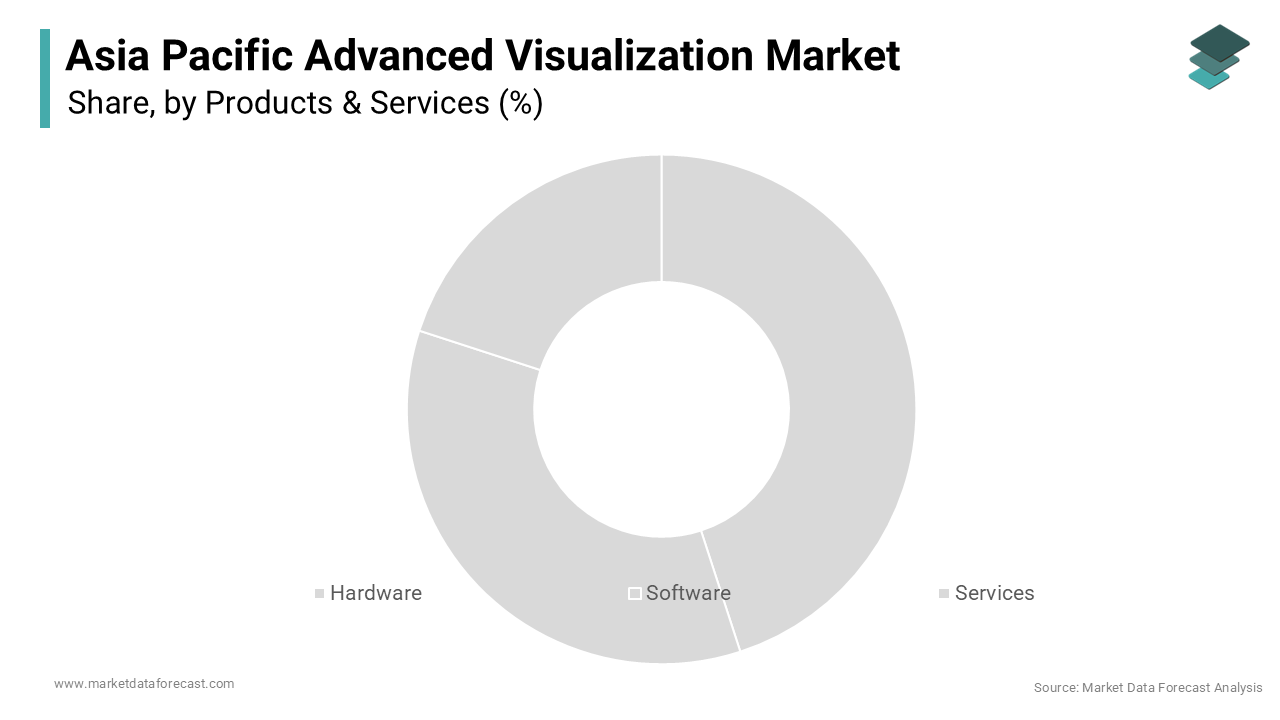
- Based on products and services, the software segment dominated the Asia Pacific advanced visualization market in 2025. The dominance of the segment is attributed to the widespread adoption of cloud-native architectures, subscription-based software deployment models, seamless integration with multiple imaging modalities, and continuous incorporation of artificial intelligence-powered visualization capabilities. Lower total cost of ownership and enhanced accessibility further strengthen segment growth.
- The services segment is projected to witness the fastest CAGR of 14.2% during the forecast period owing to increasing demand for implementation support, consulting, managed services, technical training, workflow optimization, and system integration across healthcare providers and industrial enterprises.
- Based on solution, the enterprise solutions segment dominated the Asia Pacific advanced visualization market in 2025. The growth of the segment is driven by centralized data management capabilities, improved interoperability, enhanced cybersecurity, regulatory compliance, and increasing adoption by large hospital networks and multinational manufacturing organizations requiring enterprise-wide visualization platforms.
- The standalone solutions segment is anticipated to register the fastest CAGR of 12.8% during the forecast period due to increasing affordability, rapid deployment capabilities, growing adoption among small and medium-sized enterprises, expanding utilization in diagnostic centers, and increasing demand for specialized visualization applications requiring minimal infrastructure investment.
- Based on imaging modality, the computed tomography (CT) segment dominated the Asia Pacific advanced visualization market in 2025. The dominance of the segment is attributed to the high volume of CT examinations, widespread availability of CT scanners, increasing utilization for oncology, trauma, cardiovascular, and emergency diagnostics, and growing demand for advanced three-dimensional image reconstruction and post-processing solutions.
- The magnetic resonance imaging (MRI) segment is expected to witness the fastest CAGR of 11.5% during the forecast period owing to increasing demand for superior soft tissue imaging, expanding neuroimaging applications, growing cancer diagnosis and monitoring, rising installation of advanced MRI systems, and continuous development of functional and diffusion-weighted MRI visualization technologies.
Regional Insights
- China dominated the Asia Pacific advanced visualization market and accounted for 32.5% of the regional market share in 2025. The country's leadership is driven by extensive government investments in healthcare digitalization, rapid expansion of smart manufacturing initiatives, growing deployment of artificial intelligence in medical imaging, and strong domestic medical device manufacturing capabilities. Large patient datasets and widespread digital healthcare adoption continue to strengthen market growth.
- Japan held 22.8% of the Asia Pacific advanced visualization market share in 2025 owing to its advanced healthcare infrastructure, highest global imaging utilization rates, strong adoption of artificial intelligence-assisted diagnostics, expanding aging population, and significant investments in precision medicine and digital manufacturing technologies.
- India continues to maintain a significant position in the regional market due to rapid healthcare infrastructure development, expanding digital health initiatives, increasing private hospital investments, growing medical tourism, and rising adoption of cloud-based visualization platforms to address shortages of imaging specialists.
- South Korea is witnessing strong growth supported by its advanced digital infrastructure, widespread 5G connectivity, increasing deployment of artificial intelligence-powered medical imaging solutions, expanding smart factory initiatives, and strong government support for digital healthcare transformation.
- Australia is expected to experience notable growth during the forecast period owing to high healthcare expenditure, increasing implementation of national digital health programs, expanding telehealth adoption, growing investments in advanced medical imaging infrastructure, and rising utilization of visualization technologies across healthcare and industrial sectors.
Competitive Landscape
The Asia Pacific advanced visualization market is highly competitive and characterized by the presence of multinational healthcare technology companies, medical imaging providers, and regional software developers competing through technological innovation, artificial intelligence integration, cloud-based deployment, and localized product development. Leading companies are focusing on developing advanced visualization software, expanding enterprise imaging platforms, integrating machine learning algorithms, strengthening regional research and development capabilities, and enhancing interoperability with existing healthcare and industrial systems. Strategic partnerships with hospitals, governments, research institutions, and industrial enterprises continue to strengthen competitive positioning across the Asia Pacific advanced visualization market. The prominent players operating in the Asia Pacific advanced visualization market include General Electric Company, Canon Inc., Siemens AG, Koninklijke Philips N.V., Fujifilm Holdings Corporation, Toshiba Corporation, TeraRecon, Inc., Carestream Health, Inc., Pro Medicus Limited, Ziosoft, Inc., Agfa-Gevaert N.V., and Qi Imaging, LLC.
Asia Pacific Advanced Visualization Market Size
The Asia Pacific advanced visualization market size was valued at USD 0.53 billion in 2025 and is anticipated to reach USD 0.60 billion in 2026 from USD 1.60 billion by 2034, growing at a CAGR of 13% during the forecast period from 2026 to 2034.
Advanced Visualization is a sophisticated ecosystem of software and hardware solutions designed to transform complex multidimensional data into intuitive visual representations for enhanced decision making. This domain is pivotal in healthcare industrial manufacturing and urban planning where the interpretation of large datasets requires high fidelity rendering and interactive capabilities. In healthcare these tools facilitate precise surgical planning and diagnostic accuracy by creating three dimensional models from computed tomography and magnetic resonance imaging scans. According to the World Health Organization, non-communicable diseases (NCDs) are the leading cause of death and disability in the Western Pacific region, responsible for 80% of all deaths within an area that houses over a quarter of the global population. As per the Asian Development Bank, rapid urbanization and economic growth mean that developing Asia will require a massive $26 trillion investment in infrastructure through 2030 (or $1.7 trillion annually) to support smart city expansions and transport networks. The proliferation of high speed internet connectivity with 5G coverage expanding to significant portion of the regional population enables real time data processing and cloud based visualization services. Regulatory bodies such as the National Medical Products Administration in China are increasingly mandating the use of digital health records and advanced imaging standards which further propels the adoption of visualization software. The integration of artificial intelligence with visualization platforms allows for automated anomaly detection and predictive analytics transforming raw data into actionable insights across various verticals.
MARKET DRIVERS
Rising Prevalence Of Chronic Diseases And Demand For Precision Medicine
The escalating prevalence of chronic diseases in the region contributes to the growth of the Asia Pacific advanced visualization market. This drives the adoption of advanced visualization technologies particularly in the healthcare sector. According to the International Diabetes Federation (IDF), the combined Western Pacific and South-East Asia regions account for over 296 million adults living with diabetes, representing more than 55% of the global total. Advanced visualization tools enable clinicians to create detailed three dimensional reconstructions of patient anatomy facilitating minimally invasive surgeries and personalized treatment plans. The Global Cancer Observatory (GCO) estimates that aging demographics will cause new cancer cases in Asia to surge by over 60% by 2040, accelerating demand for oncology staging workflows. Hospitals in developed economies like Japan and South Korea are increasingly investing in hybrid operating rooms equipped with real time visualization systems to improve surgical outcomes. The shift towards value based healthcare encourages providers to utilize technologies that enhance diagnostic accuracy and reduce hospital stays. Furthermore government initiatives in countries like Australia and New Zealand to modernize public health infrastructure include funding for advanced imaging centers. This clinical necessity combined with technological advancements ensures sustained demand for high resolution visualization solutions that support precision medicine protocols.
Rapid Industrialization And Adoption Of Industry 4.0 Standards
Rapid industrialization and the widespread adoption of Industry 4.0 standards across manufacturing hubs in the region significantly propel the expansion of the Asia Pacific advanced visualization market. The United Nations Industrial Development Organization (UNIDO) confirms that Asia remains a global manufacturing powerhouse, accounting for over 40% of the world's total manufacturing value added. Manufacturers are increasingly implementing digital twin technologies and augmented reality visualization to optimize production lines monitor equipment health and simulate process changes before physical implementation. Official guidelines from Japan's Ministry of Economy, Trade and Industry (METI) mandate urgent corporate migration to real-time industrial data networks to prevent an economic slowdown driven by outdated legacy IT frameworks. These tools allow engineers to visualize complex supply chain dynamics and identify bottlenecks instantly reducing downtime and waste. According to the Department for Promotion of Industry and Internal Trade (DPIIT), the implementation of advanced automation technology is structurally heavily incentivized to expand output across core sectors like auto and tech. The need for remote collaboration and training in a post pandemic world has further accelerated the use of virtual reality visualization for employee upskilling. Governments in the region are providing incentives for technology adoption through initiatives like Made in China 2025 and Smart Manufacturing in South Korea. This strategic focus on digital integration creates a robust market for visualization platforms that enhance industrial competitiveness and innovation.
MARKET RESTRAINTS
High Initial Implementation Costs and Infrastructure Limitations
The high initial implementation costs associated with advanced visualization systems limit their accessibility especially for small and medium sized enterprises and public healthcare facilities in developing nations, which hinders the growth of the Asia Pacific advanced visualization market. Studies highlight that implementing advanced visualization infrastructure requires heavy capital expenditures spanning dedicated diagnostic workstations, localized servers, and specialized medical software licensing. This financial barrier is prohibitive for many organizations in emerging economies where budget constraints are severe. The World Bank shows that annual health expenditures per capita in low-income Asian nations remain below $60, severely limiting local healthcare facilities from acquiring high-end diagnostic software and imaging assets. In the industrial sector small manufacturers often lack the capital to upgrade legacy systems to support real time visualization requirements. The Asian Productivity Organization (APO) underscore that while basic digital communication is common, the integration of advanced data visualization tools remains low among regional small and medium enterprises. Additionally the requirement for robust IT infrastructure including high bandwidth networks and secure data storage adds to the total cost of ownership. Many rural hospitals and factories in regions like Indonesia and the Philippines face unreliable electricity and internet connectivity which hampers the effective operation of cloud based visualization services. These economic and infrastructural challenges slow down the widespread adoption of advanced visualization technologies despite their proven benefits.
Shortage Of Skilled Professionals And Technical Expertise
A critical shortage of skilled professionals capable of operating and interpreting these tools restricts the growth of the Asia Pacific advanced visualization market. Sources indicate that a structural gap in advanced software literacy presents a major obstacle to scaling complex data visualization systems in developing regions. In healthcare radiologists and surgeons require specialized training to effectively utilize three dimensional reconstruction and augmented reality interfaces for clinical decision making. Research shows that developing nations across South Asia face an intense imaging backlog, with a radiologist density falling below one specialist per 100,000 people. This scarcity leads to underutilization of installed systems and limits the potential return on investment. In the industrial domain engineers and technicians often lack the skills to interpret digital twin data and integrate visualization outputs into workflow processes. Training programs are limited and often expensive further exacerbating the skills gap. Without adequate human capital the sophisticated capabilities of advanced visualization systems remain untapped. Organizations hesitate to invest in new technologies when they cannot find qualified staff to manage them effectively. This human resource bottleneck impedes the scalability and efficiency of visualization deployments.
MARKET OPPORTUNITIES
Integration With Artificial Intelligence and Machine Learning Algorithms
The integration of advanced visualization platforms with artificial intelligence and machine learning algorithms offers a substantial opportunity for the expansion of the Asia Pacific advanced visualization market. This enhances analytical capabilities and automation. According studies, integrating advanced automation and generative AI into enterprise platforms has the potential to automate 60% to 70% of routine data tasks, freeing professionals to focus on strategic execution. In healthcare AI algorithms can automatically segment organs and detect anomalies in medical images which are then visualized in three dimensions for surgeon review. The synergy creates value added services that appeal to healthcare providers seeking to improve patient outcomes and operational efficiency. In the industrial sector AI powered visualization can predict equipment failures by analyzing sensor data and presenting it through intuitive dashboards. Vendors can differentiate their offerings by embedding AI capabilities directly into visualization software creating sticky ecosystems for customers. The growing availability of large datasets in the region provides ample fuel for training these algorithms. Governments are also promoting AI research and development through funding initiatives creating a favorable environment for innovation. This technological convergence opens new revenue streams and application scenarios for visualization providers.
Expansion Into Emerging Verticals Such As Smart Cities And Agriculture
The expansion of advanced visualization technologies into emerging verticals such as smart city management and precision agriculture paves the way for the expansion of the Asia Pacific advanced visualization market. According to the United Nations Department of Economic and Social Affairs (UN DESA), Asia's urban centers are projected to absorb an additional 740 million residents by 2050, driving critical demands for smart resource management. Visualization platforms enable city planners to simulate traffic flows energy consumption and emergency response scenarios in real time. Under modernization blueprints managed by China's Ministry of Housing and Urban-Rural Development (MOHURD), designated pilot smart cities leverage real-time spatial mapping systems to monitor infrastructure logistics and urban traffic matrices. In agriculture visualization tools help farmers monitor crop health soil moisture and pest infestations using drone imagery and satellite data. These applications address critical challenges related to food security and urban sustainability. Government initiatives supporting digital agriculture and smart infrastructure provide funding and regulatory support for adoption. The ability to visualize complex environmental data helps stakeholders make informed decisions regarding resource allocation. As these sectors mature the demand for specialized visualization solutions tailored to their unique needs will grow. Providers who develop industry specific modules can capture early mover advantages in these high potential markets.
MARKET CHALLENGES
Data Privacy Concerns And Regulatory Compliance Complexities
Data privacy concerns and the complexity of navigating diverse regulatory frameworks hold back the growth of the Asia Pacific advanced visualization market. The United Nations Conference on Trade and Development (UNCTAD) shows that strict personal data privacy laws are now active across a majority of regional markets, imposing tight compliance mandates on international vendors. These regulations impose stringent requirements on the storage processing and cross border transfer of sensitive data including medical images and industrial proprietary information. Healthcare providers are particularly cautious about using cloud based visualization services due to fears of data breaches and unauthorized access. According to the IBM Cost of a Data Breach Report, cyber incident financial damages have scaled aggressively, reaching an average cost of $3.67 million per breach within the ASEAN sector and $3.65 million in Japan. In the industrial sector companies are reluctant to share operational data on centralized platforms due to intellectual property concerns. The lack of harmonized regional standards complicates the development of unified solutions. Vendors must implement robust encryption and access control measures which increase system complexity and cost. Failure to comply can result in heavy fines and reputational damage. These regulatory hurdles slow down deployment timelines and increase the total cost of ownership for end users.
Interoperability Issues with Legacy Systems
Interoperability issues with existing legacy systems are a major technical barrier for the seamless integration of advanced visualization tools in the Asia Pacific market. Sources indicate that a major barrier to modernizing visualization pipelines is the presence of older industrial systems that lack native support for modern internet communication protocols. In healthcare the absence of universal adherence to Digital Imaging and Communications in Medicine standards in smaller clinics hinders the aggregation of imaging data for comprehensive visualization. In the industrial sector older machinery often does not have sensors or connectivity features necessary to feed real time data into visualization dashboards. Research shows that retrofitting older physical machinery with smart telemetry components represents a significant upfront cost for legacy manufacturing facilities aiming to deploy real-time monitoring tools. This fragmentation forces organizations to maintain parallel systems or invest heavily in middleware solutions. The lack of standardized APIs across different vendor platforms further complicates integration efforts. Users face difficulties in achieving a unified view of their operations due to data silos. These technical barriers reduce the immediate value proposition of advanced visualization tools and discourage investment. Overcoming these interoperability challenges requires significant engineering effort and collaboration among stakeholders.
REPORT COVERAGE
| REPORT METRIC | DETAILS |
| Market Size Available | 2025 to 2034 |
| Base Year | 2025 |
| Forecast Period | 2026 to 2034 |
| CAGR | 13% |
| Segments Covered | By Product & Services, Solution, Imaging Modality, Clinical Application, End-User and Country. |
| Various Analyses Covered | Global, Regional & Country Level Analysis, Segment-Level Analysis, DROC, PESTLE Analysis, Porter’s Five Forces Analysis, Competitive Landscape, Analyst Overview of Investment Opportunities |
| Regions Covered | China, India, Japan, South Korea, Australia, New Zealand, Thailand, Indonesia, Philippines, Vietnam, Singapore, Rest of APAC. |
| Market Leaders Profiled | General Electric Company, Canon Inc., Siemens AG, Koninklijke Philips N.V, Fujifilm Holdings Corporation, Toshiba Corporation, Terarecon, Inc., Carestream Health, Inc., Pro Medicus Limited, Ziosoft, Agfa-Geveart N.V, and Qi Imaging, LLC. |
SEGMENTAL ANALYSIS
By Products and Services Insights
The software segment dominated the Asia Pacific Advanced Visualization Market and accounted for a substantial share in 2025. This dominance of the segment was driven by the widespread transition toward cloud native architectures and flexible subscription based licensing models. The shift allows healthcare providers and industrial firms to access high end visualization capabilities without maintaining expensive local hardware. The software segment benefits from continuous updates and feature enhancements delivered remotely ensuring users always have access to the latest algorithms without disruptive installations. Furthermore regulatory pushes for digital health records in countries like Australia and Japan mandate interoperable software platforms that can integrate with diverse imaging modalities. The ability to deploy visualization applications across multiple endpoints including tablets and mobile devices further expands the user base beyond traditional workstations. This accessibility combined with lower total cost of ownership solidifies software as the primary revenue generator in the market ecosystem.
The deep integration of artificial intelligence and machine learning algorithms directly into visualization software drives its market leadership by automating complex analytical tasks. These intelligent software platforms can automatically segment anatomical structures detect anomalies and generate three dimensional reconstructions which significantly improves clinical workflow efficiency. In the industrial sector predictive maintenance software utilizes visualization to forecast equipment failures before they occur reducing unplanned downtime, according to sources. Vendors are increasingly bundling AI capabilities as standard features rather than optional add ons making advanced analytics accessible to a broader range of users. The continuous improvement of these algorithms through real world data feedback loops creates a compounding value effect that standalone hardware cannot match. This technological synergy ensures software remains the central component of advanced visualization deployments.
The services segment is estimated to register the fastest CAGR of 14.2% over the forecast period due to the critical need for professional implementation support and specialized training. Studies indicate that a widening digital literacy gap highlights the critical necessity for specialized technical support and continuous professional education to maximize the utility of complex medical systems. Healthcare institutions require hands on training to ensure clinicians can effectively utilize complex visualization tools for surgical planning and diagnosis. The complexity of integrating visualization platforms with existing electronic health records and industrial control systems also fuels demand for consulting and integration services. Vendors are expanding their service portfolios to include ongoing technical support optimization audits and custom development to retain customers. This shift toward outcome based service delivery models transforms one time product sales into long term recurring revenue streams accelerating segment growth.
The rising trend of managed services and business process outsourcing is propelling the services segment forward as organizations seek to reduce internal IT burdens. Managed service providers handle everything from system maintenance and data management to user support allowing clients to convert fixed costs into variable expenses. In healthcare third party vendors are increasingly managing picture archiving and communication systems and visualization workflows to ensure compliance and uptime. This model is particularly attractive in emerging markets where skilled IT talent is scarce. The scalability of managed services allows organizations to adjust capacity based on demand without capital investment. These factors collectively drive the rapid expansion of the services segment across diverse verticals.
By Solution Insights
The enterprise solutions segment led the Asia Pacific Advanced Visualization Market and captured a significant share in 2025. This leading position of the segment was attributed to its superior scalability and centralized data management capabilities required by large organizations. Large hospital networks and multinational manufacturers need integrated systems that can aggregate data from multiple sources and locations into a single coherent view. These solutions enable standardized workflows and consistent reporting across departments which is essential for regulatory compliance and quality improvement. The ability to manage user permissions security protocols and software updates centrally reduces administrative overhead and enhances cybersecurity. Enterprise solutions also offer better integration with business intelligence platforms enabling executive level decision making. This comprehensive functionality makes enterprise deployments the preferred choice for mature organizations seeking holistic visibility.
Stringent regulatory requirements and industry standardization mandates reinforce the dominance of enterprise solutions across regulated sectors in the region. Standalone tools often lack the robust governance frameworks necessary to meet these compliance obligations creating risk for large organizations. In the financial and industrial sectors regulations regarding data sovereignty and privacy require centralized control mechanisms that only enterprise solutions can provide. Enterprise vendors invest heavily in obtaining regional certifications and maintaining alignment with evolving standards creating high barriers to entry for smaller players. The need for cross border data transfer compliance in multinational corporations further favors enterprise platforms with built in localization features. These regulatory drivers ensure enterprise solutions remain the default choice for risk averse large scale deployments.
The standalone solutions segment is anticipated to witness the fastest CAGR of 12.8% from 2026 to 2034 owing to its affordability and suitability for small and medium enterprises and niche applications. According to the Asian Development Bank (ADB), small and medium-sized enterprises (SMEs) account for more than 98% of all businesses in Asia, presenting an immense market that relies heavily on affordable, scalable software. Standalone visualization tools offer targeted functionality at a fraction of the cost enabling smaller organizations to digitize specific workflows without massive infrastructure investment. In healthcare private clinics and diagnostic centers prefer standalone viewers that integrate with existing PACS without requiring full system overhauls. The plug and play nature of these solutions reduces implementation time from months to days appealing to resource constrained users. Vendors are increasingly offering freemium or pay per use models to lower entry barriers further. This democratization of advanced visualization technology drives rapid adoption in underserved market segments.
The flexibility and rapid deployment capabilities of standalone solutions accelerate their growth as organizations seek agile responses to specific operational challenges. Standalone visualization applications can be deployed on existing hardware and configured for specialized tasks such as dental implant planning or jewelry design within hours. These solutions allow users to customize interfaces and workflows without affecting core enterprise systems reducing organizational resistance to change. The ability to test new visualization approaches on a small scale before enterprise wide rollout minimizes risk. Vendors are responding with app store style marketplaces where users can download specialized modules as needed. This agility makes standalone solutions ideal for dynamic environments where requirements evolve quickly.
By Imaging Modality Insights
In 2025, the computed tomography (CT) segment held the majority share of the Asia Pacific Advanced Visualization Market because of the exceptionally high volume of diagnostic procedures performed annually. According to OECD Health Statistics, Japan records the highest global rate of utilization with over 230 CT examinations per 1,000 population annually, driving massive workflows for clinical post-processing and diagnostic software. Similar trends are observed in South Korea and China where aging populations and rising chronic disease burdens drive frequent imaging utilization. CT generates volumetric datasets that inherently require advanced rendering for accurate interpretation unlike two dimensional modalities. The widespread availability of CT scanners even in secondary care facilities ensures broad market penetration. Furthermore trauma and emergency medicine protocols universally depend on rapid CT visualization for critical decision making. This procedural ubiquity combined with the intrinsic three dimensional nature of CT data solidifies its dominance in the visualization landscape.
Continuous technological advancements in dual energy and spectral CT imaging drive sustained leadership by creating new visualization requirements that older systems cannot fulfill. These advanced techniques generate multiple datasets simultaneously requiring sophisticated visualization software to decompose and display material specific information. Vendors are developing dedicated spectral visualization modules that enable virtual monochromatic imaging and iodine mapping which are becoming standard of care in oncology and vascular imaging. The clinical value of these enhanced visualizations justifies premium pricing and upgrade cycles. Regulatory approvals for new spectral applications continue to expand the addressable market. This innovation cycle ensures CT remains at the forefront of visualization technology adoption.
The Magnetic Resonance Imaging (MRI) segment is likely to experience the fastest CAGR of 11.5% during the forecast period. This rapid growth of the segment is propelled by increasing demand for superior soft tissue contrast in oncology and neurology applications. MRI provides unparalleled detail for brain spine and musculoskeletal imaging that CT cannot replicate making advanced visualization essential for surgical planning. The aging population in Japan and South Korea drives demand for neurodegenerative disease assessment where MRI is the gold standard. Government initiatives to improve cancer care infrastructure in India and Indonesia are funding new MRI installations expanding the installed base. Unlike CT which is often used for acute conditions MRI is increasingly employed for longitudinal monitoring creating recurring visualization needs. This clinical indispensability in high growth therapeutic areas accelerates segment expansion.
Technological breakthroughs in functional and diffusion weighted MRI are fueling rapid growth by unlocking new clinical applications that require specialized visualization. These advanced techniques visualize white matter tracts and metabolic activity enabling surgeons to avoid eloquent brain regions during tumor resection. The integration of quantitative MRI biomarkers into visualization platforms enables objective disease tracking for clinical trials and personalized therapy. Vendors are developing automated tractography and perfusion analysis tools that make complex data clinically actionable. Regulatory bodies are increasingly recognizing these advanced biomarkers as valid endpoints accelerating clinical adoption. The expansion of MRI into cardiac and liver fibrosis assessment opens additional growth avenues. These technological frontiers position MRI as the most dynamic segment in the visualization market.
COUNTRY ANALYSIS
China Advanced Visualization Market Analysis
China was the top performer in the Asia Pacific Advanced Visualization Market and occupied a 32.5% share in 2025. This supremacy of the country’s market was driven by massive government investments in healthcare digitalization and smart manufacturing. According to China's National AI Healthcare Strategy, the government has mandated a phased multi-million dollar infrastructure expansion to ensure all Grade 2 and higher hospitals are fully integrated with AI-driven diagnostic and primary care tools by 2030. This funding has accelerated the replacement of legacy systems with advanced visualization capable equipment across tier two and tier three cities. In addition, the Ministry of Industry and Information Technology (MIIT) shows that China has established over 30,000 smart factories, with 421 designated as national-level demonstration facilities where more than 90% actively utilize AI and digital twin visualization. The domestic medical device industry supported by policies encouraging indigenous innovation has produced competitive local visualization platforms gaining market share. Driven by a severe workforce shortage where medical imaging data grows at 30% annually compared to a mere 4% growth in radiologists, China’s medical regulators have approved over 60 Class III medical device certificates to legally clear AI-aided imaging workflows for widespread hospital adoption. The vast patient volume creates unparalleled datasets for algorithm training enhancing local solution competitiveness. Cross provincial telemedicine networks mandated by policy require interoperable visualization standards driving enterprise deployments. These structural advantages sustain China’s market leadership.
Japan Advanced Visualization Market Analysis
Japan was the next prominent country in the regional market and held a 22.8% share in 2025. Factors such as the world’s highest per capita imaging utilization and advanced technological maturity have contributed to the growth of the country’s market. According to OECD Health Statistics, Japan maintains by far the highest global capacity of CT and MRI scanners per capita, creating an unparalleled baseline demand for streamlined visualization software and advanced imaging workflows. The super aged society drives continuous need for neurovascular and oncological visualization supporting dementia and cancer care. As per Japan's Ministry of Health, Labour and Welfare, national medical programs are actively funding AI-integrated diagnostic visualization systems to alleviate severe burnout among the country's aging healthcare workforce. Under the Ministry of Economy, Trade and Industry (METI) 'Manufacturing Industry X' framework, Japan is aggressively pushing its industrial sector to adopt digital twins and AI to offset severe domestic labor shortages and elevate global productivity. Strong intellectual property protection and established reimbursement codes for advanced imaging procedures incentivize technology investment. Local vendors like Canon and Fujifilm maintain dominant positions through deep integration with domestic clinical workflows. The government’s Moonshot Research and Development Program funds next generation visualization research sustaining innovation. High quality standards and regulatory rigor ensure premium market positioning. These factors maintain Japan’s sophisticated market status.
India Advanced Visualization Market Analysis
India maintains a significant position in the regional market. It is the fastest growing major economy driven by healthcare infrastructure expansion and digital public goods. According to the National Health Authority (NHA), the Ayushman Bharat Digital Mission has surpassed 739 million unique ABHA digital health IDs across the country, building a nationwide foundation for consent-based access and sharing of digital medical health records. Private hospital chains are rapidly expanding tier two city presence installing advanced imaging and visualization systems to capture medical tourism and domestic demand. However, the Indian Radiological and Imaging Association (IRIA) and healthcare networks emphasizes that India faces an intense imaging workflow bottleneck, operating with only about one practicing radiologist per 100,000 people amid rising diagnostic demands countrywide. According to NITI Aayog frameworks and central government mandates, India’s Production Linked Incentive (PLI) schemes are strategically focused on achieving self-reliance by subsidizing local manufacturing for high-end medical hardware components like MRI, CT scan, and advanced ultrasound machinery. Price sensitivity drives adoption of cloud based and standalone solutions over expensive enterprise systems. The large young population increases trauma and sports injury cases requiring orthopedic visualization. Tele radiology networks connecting rural clinics to urban specialists rely heavily on web based visualization platforms. These dynamics create unique growth patterns distinct from developed markets.
South Korea Advanced Visualization Market Analysis
South Korea is moving ahead steadfastly in the Asia Pacific advanced visualization market, due to world leading digital infrastructure and early adoption of cutting edge technologies. To maximize its high domestic digitization rates, South Korea's Ministry of Health and Welfare launched the unified 'My HealthWay' platform to consolidate medical records from fragmented hospital networks into a singular, user-consented medical data stream. Samsung and LG dominate consumer electronics while local medical AI startups gain global recognition in visualization algorithms. Supported by the regulatory fast-track programs of the Ministry of Food and Drug Safety (MFDS), South Korea has become a global leader in deploying domestic, standalone AI medical software for advanced chest and mammography imaging workflows. Under initiatives spearheaded by the Korea Smart Manufacturing Office (KOSMO), government subsidies are allocated to help small and medium enterprises transition into smart factories by building foundational data infrastructure and automated tracking systems. The dense 5G network enables real time remote visualization for telemedicine and industrial field support. Strong venture capital ecosystem supports commercialization of novel visualization technologies. Regulatory sandbox mechanisms allow rapid testing of innovative solutions. High English proficiency facilitates global partnerships and export orientation. These elements create a highly dynamic innovation driven market environment.
Australia Advanced Visualization Market Analysis
Australia is likely to grow notably in the regional market from 2026 to 2034 owing to high healthcare spending and stringent regulatory standards. According to the Australian Institute of Health and Welfare (AIHW), Australia’s total health expenditure accounts for approximately 10.5% of its national GDP, ensuring substantial structural capital for adopting advanced clinical software and premium medical technologies. The My Health Record system provides national infrastructure for shared visualization data across public and private sectors. Frameworks outlined by the Royal Australian and New Zealand College of Radiologists (RANZCR) focus on setting rigorous safety guidelines for clinical AI integration to ensure high-fidelity image reconstruction and optimal patient data protections. Australia's Department of Industry, Science and Resources highlight that the nation's major mining and resources conglomerates are globally leading investors in remote operation centers and digital twin mapping to manage complex, automated asset logistics safely. Geographic dispersion drives telehealth adoption requiring robust remote visualization capabilities. Strict Therapeutic Goods Administration approval processes ensure high quality but slow market entry. Public private partnerships fund rural imaging upgrades addressing equity concerns. Strong research institutions collaborate with industry on clinical validation. These factors sustain a mature high value market position.
COMPETITIVE LANDSCAPE
The competition in the Asia Pacific advanced visualization market is characterized by the presence of global multinational corporations and agile local startups who compete on technology innovation price and local support. Global leaders leverage their extensive product portfolios and established brand reputation to dominate large hospital networks and industrial enterprises. Local players compete by offering cost effective customizable solutions that address specific regional challenges such as language barriers and infrastructure limitations. Product differentiation is increasingly driven by artificial intelligence capabilities ease of use and integration with existing workflows. Price sensitivity remains high in emerging economies forcing suppliers to offer flexible licensing models and tiered pricing structures. Regulatory heterogeneity across countries creates barriers to entry but also opportunities for firms with strong compliance capabilities. Strategic acquisitions and partnerships are common as companies seek to expand their technological footprint and market reach. Customer loyalty is influenced by after sales support and training quality leading to high switching costs. Overall the competitive landscape is dynamic with continuous innovation shaping the future of visualization technology adoption.
KEY MARKET PLAYERS
Some of the Promising companies dominating the Asia Pacific Advanced Visualization Market include
- General Electric Company (U.S.)
- Canon Inc. (Japan)
- Siemens AG (Germany)
- Koninklijke Philips N.V. (Netherlands)
- Fujifilm Holdings Corporation (Japan)
- Toshiba Corporation (Japan)
- TeraRecon, Inc. (U.S.)
- Carestream Health, Inc. (U.S.)
- Pro Medicus Limited (Australia)
- Ziosoft, Inc. (Japan)
- Agfa-Gevaert N.V. (Belgium)
- Qi Imaging, LLC (U.S.)
Top Players in the Asia Pacific Market
Siemens Healthineers AG
Siemens Healthineers maintains a dominant position in the Asia Pacific advanced visualization market by leveraging its comprehensive portfolio of imaging hardware and integrated software solutions. The company recently expanded its artificial intelligence research center in Singapore to develop region specific algorithms for early disease detection and workflow optimization. This strategic investment allows Siemens to offer tailored visualization tools that address the unique clinical needs of diverse Asian populations. The company also partners with leading hospital networks in China and India to implement enterprise wide digital twin platforms for operational efficiency. By focusing on seamless integration between computed tomography magnetic resonance imaging and visualization software Siemens enhances diagnostic accuracy and reduces interpretation time. These initiatives strengthen its reputation as a holistic healthcare technology partner driving adoption across public and private sectors in the region.
GE Healthcare
GE Healthcare contributes significantly to the market through its Edison AI platform which integrates advanced analytics with visualization tools to support clinical decision making. The company has strengthened its market position by establishing local manufacturing and development hubs in Japan and South Korea to accelerate product customization and regulatory compliance. GE Healthcare recently launched cloud based visualization services that enable remote collaboration among radiologists addressing workforce shortages in rural areas. The company also collaborates with government health agencies to standardize imaging data formats facilitating interoperability across national health systems. By prioritizing scalable and accessible solutions GE Healthcare expands its reach to smaller clinics and emerging markets. These actions demonstrate commitment to improving healthcare equity while driving sustainable growth in the advanced visualization sector.
Canon Medical Systems Corporation
Canon Medical Systems Corporation leverages its expertise in high resolution imaging and optical technologies to deliver superior visualization solutions for complex diagnostic procedures. The company focuses on developing specialized visualization modules for neurology and cardiology which are high growth areas in the aging Asia Pacific population. Canon recently introduced augmented reality guided surgery systems in major medical centers across Australia and Thailand enhancing surgical precision and patient safety. The company also invests in training programs for radiologists and technicians to maximize the utility of its advanced visualization tools. By combining hardware innovation with educational support Canon builds strong customer loyalty and differentiates itself from pure software vendors. These efforts solidify its role as a key enabler of precision medicine in the region.
Top Strategies Used By Key Market Participants
Key players in the Asia Pacific advanced visualization market employ several strategic approaches to enhance their competitive positioning and drive growth. Companies prioritize localization by establishing regional research and development centers to create solutions tailored to specific clinical and industrial needs. Strategic partnerships with local hospitals governments and technology firms facilitate market entry and regulatory navigation. Manufacturers also focus on integrating artificial intelligence and machine learning into visualization platforms to automate analysis and improve diagnostic accuracy. Investment in cloud infrastructure enables scalable and accessible services particularly for remote and underserved areas. Training and education programs build user competence and trust ensuring effective adoption of complex tools. Compliance with diverse regional data privacy laws is maintained through robust security frameworks and legal expertise. These multifaceted strategies enable companies to overcome infrastructural and cultural barriers while capturing growth opportunities in the dynamic Asia Pacific landscape.
MARKET SEGMENTATION
This research report on the Asia Pacific Advanced Visualization Market segmented and sub-segmented into the following categories.
By-Products & Services
- Hardware
- Software
- Services
By Solution
- Standalone
- Enterprise
By Imaging Modality
- Magnetic Resonance Imaging (MRI)
- Computed Tomography (CT)
- Positron Emission Tomography (PET)
- Ultrasound
- Radiotherapy
- Nuclear Medicine
- Others
By Clinical Application
- Radiology
- Orthopedics
- Cardiac
- Neurology
- Oncology
- Vascular
- Neurology
- Others
By End User
- Hospitals & Surgical Centers
- Imaging Centers
- Academic & Research Centers
- Others
By Country
- India
- China
- Japan
- South Korea
- Australia
- New Zealand
- Thailand
- Malaysia
- Vietnam
- Philippines
- Indonesia
- Singapore
- Rest of APAC.
Related Reports
Access the study in MULTIPLE FORMATS
Purchase options starting from
$ 2000
Didn’t find what you’re looking for?
TALK TO OUR ANALYST TEAM
Need something within your budget?
NO WORRIES! WE GOT YOU COVERED!
Call us on: +1 888 702 9696 (U.S Toll Free)
Write to us: sales@marketdataforecast.com