Middle East And Africa Transfection Reagents And Equipment Market Research Report By Product, Method, Application, End User & Country (KSA, UAE, Israel, rest of GCC countries, South Africa, Ethiopia, Kenya, Egypt, Sudan, rest of MEA) - Industry Analysis, Size, Share, Growth, Trends, & Forecasts (2026 to 2034)
MEA Transfection Reagents and Equipment Market Size
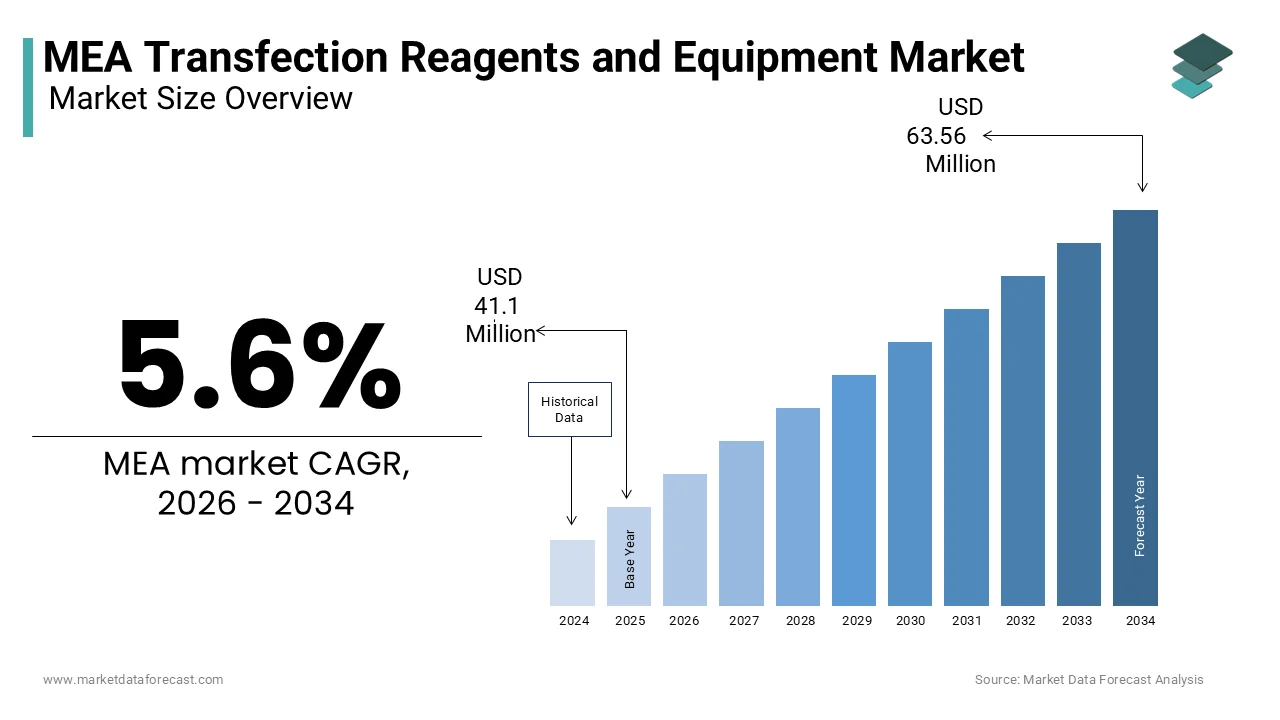
The MEA transfection reagents and equipment market was valued at USD 38.92 million in 2025 and increased to USD 41.1 million in 2026. The market is projected to reach USD 63.56 million by 2034, growing at a CAGR of 5.6% from 2026 to 2034.
Transfection reagents and equipment consist of specialized chemical formulations and physical delivery systems engineered to introduce genetic material, such as DNA or RNA, into target cells for applications in medical research, vaccine development, and therapeutic manufacturing. This ecosystem includes lipid-based reagents, polymer-based carriers, electroporation systems, and microinjection devices that serve as foundational enablers for gene therapy research, vaccine development, and functional genomics studies. The definition extends beyond mere delivery mechanisms to include technologies that ensure high transfection efficiency while minimizing cytotoxicity in diverse cell lines. Current scientific scenarios in the region reveal a strategic pivot toward indigenous biomedical research capabilities, driven by the urgent need to address region-specific genetic disorders and infectious diseases. According to the World Health Organization, the Eastern Mediterranean region carries a high burden of inherited blood disorders, such as thalassemia and sickle cell disease, driving a critical need for advanced genetic research and specialized therapeutic protocols. Furthermore, data from the African Union identifies a strategic push to create regional centers of excellence in biotechnology, intended to foster local innovation and enhance the continent's self-sufficiency in medical and pharmaceutical solutions. The Islamic Development Bank has prioritized investments in science and technology infrastructure for its member states, establishing a foundation for modern laboratory capabilities and the adoption of advanced research consumables. Besides, the regulatory landscape is evolving, with nations like Saudi Arabia and South Africa implementing stricter biosafety guidelines that influence the procurement of certified reagents and equipment, shaping a market defined by a transition from basic academic inquiry to applied therapeutic development.
MARKET DRIVERS
Escalating Investment in Genomic Research and Precision Medicine Initiatives
The surging government and private sector investment in genomic research and precision medicine initiatives serves as a main growth enabler for the growth of the MEA transfection reagents and equipment market. Nations are increasingly recognizing the potential of gene therapy and personalized medicine to address hereditary conditions prevalent in the region, driving the establishment of large-scale sequencing and functional genomics projects. According to Saudi Vision 2030 objectives, the Kingdom is investing heavily in the life sciences sector through large-scale genomic initiatives designed to map population-specific genetic variants and advance precision medicine. This massive undertaking requires extensive downstream validation using transfection techniques to study gene function and develop targeted therapies. Similarly, in South Africa, the Department of Science and Innovation has prioritized genomics as a key area for economic growth, funding projects that utilize CRISPR-Cas9 and other gene-editing tools, which depend on high-efficiency delivery systems. Studies indicate a steady rise in the number of operational genomics facilities, leading to a corresponding increase in the demand for advanced molecular delivery systems and specialized laboratory equipment. The shift from descriptive genetics to functional interrogation of the genome ensures a sustained and growing demand for sophisticated transfection technologies, pushing research institutions to upgrade their reagent portfolios to handle complex primary cells and difficult-to-transfect lineages.
Expansion of Biopharmaceutical Manufacturing and Vaccine Production Capabilities
The aggressive expansion of local biopharmaceutical manufacturing and vaccine production is also driving the expansion of the MEA transfection reagents and equipment market. This growth is largely a response to global supply chain disruptions. Governments across the region are prioritizing health security by establishing domestic facilities for the production of biologics, monoclonal antibodies, and mRNA vaccines, all of which rely critically on transient transfection processes for protein expression. According to the African Centers for Disease Control and Prevention, the goal to manufacture 60 percent of Africa's vaccine needs locally by 2040 has spurred the construction of multiple fill-and-finish and upstream processing facilities in countries like Egypt, Morocco, and Senegal. These facilities require vast quantities of GMP-grade transfection reagents and scalable electroporation systems to produce viral vectors and recombinant proteins efficiently. As per data from the Gulf Cooperation Council standardization organization, new regulatory frameworks are facilitating the approval of locally produced biologics, encouraging pharmaceutical companies to invest in state-of-the-art cell culture suites equipped with advanced delivery technologies. The recent success of mRNA vaccine technology has further amplified this trend, as the production of mRNA-lipid nanoparticle complexes demands precise and highly optimized transfection protocols. This industrial scaling up transforms the market from a purely academic consumer base to a robust industrial sector, driving volume demand for bulk reagents and automated high-throughput transfection equipment that can meet commercial manufacturing standards.
MARKET RESTRAINTS
High Cost of Proprietary Reagents and Specialized Equipment
The adoption of new transfection methods is heavily restricted by the high cost of proprietary reagents and specialized hardware, which in turn hampers the growth of the MEA transfection reagents and equipment market. These financial barriers disproportionately affect public research institutions and academia in Africa and parts of the Middle East. Advanced lipid-based reagents and automated electroporation systems often command price points that are substantially higher than traditional methods, placing them out of reach for laboratories operating on limited grants or fixed government budgets. In many public universities, strict procurement caps and currency fluctuations further exacerbate the affordability crisis, making it difficult to sustain long-term projects that require consistent reagent quality. The recurring nature of reagent consumption creates a continuous financial burden, whereas the high capital expenditure for equipment like nucleofectors prevents many labs from accessing modern transfection technologies altogether. This economic disparity creates a fragmented market where cutting-edge gene delivery tools are confined to elite private institutes and well-funded multinational collaborations, while the broader research community remains underserved, stifling innovation and slowing the pace of scientific discovery in the region.
Fragmented Regulatory Frameworks and Importation Bottlenecks
The highly fragmented regulatory environment and cumbersome importation procedures across the region pose a substantial impediment to the expansion of the MEA transfection reagents and equipment market. Consequently, this leads to prolonged delays and supply chain inconsistencies. Unlike unified markets, the region comprises dozens of countries with distinct regulatory authorities, varying documentation requirements for biological materials, and disparate customs clearance processes that complicate the timely arrival of temperature-sensitive products. In nations like Nigeria and Kenya, the lack of harmonized regulations for in vitro diagnostic and research reagents means that manufacturers must navigate separate registration pathways for each country, often taking several months to secure approval. The requirement for specific import licenses for equipment containing electronic components or lasers further adds layers of complexity. The lack of a centralized regulatory body for research consumables forces companies to maintain complex logistics networks and dedicated regulatory teams for each jurisdiction, straining resources and slowing down the overall pace of market penetration. Regulatory harmonization still needs to be achieved. Until then, these administrative barriers will remain a persistent obstacle to efficient commercialization and reliable access to critical research tools.
MARKET OPPORTUNITIES
Rise of Contract Research Organizations and Outsourced Drug Discovery
The burgeoning presence of Contract Research Organizations (CROs) and the increasing trend of outsourced drug discovery in the Middle East offer a lucrative opportunity to expand the transfection reagents and equipment market. Countries like Israel, Turkey, and the United Arab Emirates are actively positioning themselves as regional hubs for pharmaceutical R&D, attracting multinational corporations seeking cost-effective yet high-quality research services. The CROs require high-throughput transfection platforms and premium reagents to screen thousands of compounds and genetic targets efficiently for their clients. Besides, the drive to accelerate drug development timelines forces these organizations to adopt the latest automation and optimization technologies, creating a dedicated demand stream for advanced electroporation systems and novel delivery vectors. Furthermore, the focus on orphan diseases prevalent in the region encourages specialized research projects that rely on precise gene editing techniques. This shift toward a service-based research economy offers manufacturers a pathway to introduce high-margin, high-volume products, leveraging the operational scale of CROs to drive adoption and brand loyalty across the broader regional market.
Integration of Artificial Intelligence in Gene Delivery Optimization
The integration of Artificial Intelligence (AI) and machine learning algorithms into gene delivery optimization provides a potential prospect for the expansion of the MEA transfection reagents and equipment market. As research institutions strive to improve transfection efficiency in difficult cell types, AI-driven platforms that predict optimal reagent combinations, pulse parameters, and cell conditions are gaining traction. According to sources, there is a growing collaboration between data scientists and biologists in the region to develop predictive models that minimize trial-and-error in experimental design. This technological convergence allows researchers to achieve higher yields with lower reagent volumes, addressing both cost and efficiency concerns. The opportunity lies in the development of cloud-based software solutions that accompany hardware, offering remote monitoring and data analytics capabilities that appeal to modern, connected laboratories. Manufacturers who can bundle their reagents and equipment with AI-powered optimization tools can differentiate their offerings, providing value beyond the physical product. This digital transformation aligns with the broader push toward Industry 4.0 in the region's scientific sector, opening new revenue streams and fostering deeper customer engagement through data-driven insights.
MARKET CHALLENGES
Acute Shortage of Skilled Personnel and Technical Expertise
There is an acute shortage of personnel trained in advanced molecular biology techniques and the specific handling of these modern systems, which hinders the growth of the MEA transfection reagents and equipment. As a result, this skills gap severely restricts market growth and optimal device utilization across the MEA region. Effective use of sophisticated reagents and equipment, particularly for primary cells and stem cells, requires specialized training and extensive hands-on experience to avoid common pitfalls like low efficiency or high cytotoxicity. Even in countries with robust educational systems like Iran and Turkey, there is a notable gap in proficiency with newer high-throughput and automated transfection platforms due to insufficient continuous professional development programs. The skills gap leads to underutilization of expensive equipment and inconsistent experimental results, which in turn discourages laboratory directors from investing in advanced transfection portfolios. A robust pipeline of trained professionals and accessible education is required to unlock the market's full potential. Without this human expertise, safe and efficient technology deployment remains impossible.
Instability of Cold Chain Infrastructure for Temperature-Sensitive Reagents
The instability of cold chain infrastructure and frequent power outages in many parts of the region are critical challenges to the MEA transfection reagents and equipment market. These issues compromise the integrity and efficacy of temperature-sensitive transfection reagents. Many lipid-based reagents, enzymes, and competent cells require strict storage at -20°C or -80°C to maintain stability, yet unreliable electricity grids and inadequate refrigeration facilities pose severe risks of spoilage during storage and last-mile delivery. In remote areas and even some urban centers, frequent power cuts can render ultra-low temperature freezers ineffective within hours, destroying valuable inventory. The logistical challenge of transporting frozen reagents from ports to inland laboratories without temperature excursions is compounded by poor road networks and limited specialized courier services. This infrastructure deficit not only endangers research continuity but also erodes trust in the reliability of imported biological products. Combating this issue requires significant investment in solar-powered cooling solutions and robust logistics networks, yet the scale of the infrastructural gap remains a daunting obstacle to market reliability and growth.
REPORT COVERAGE
| REPORT METRIC | DETAILS |
| Market Size Available | 2025 to 2034 |
| Base Year | 2025 |
| Forecast Period | 2026 to 2034 |
| Segments Covered | By Product, Method, Application, End User, and Region. |
| Various Analyses Covered | Global, Regional, and Country-Level Analysis, Segment-Level Analysis, Drivers, Restraints, Opportunities, Challenges; PESTLE Analysis; Porter’s Five Forces Analysis, Competitive Landscape, Analyst Overview of Investment Opportunities |
| Countries Covered | Saudi Arabia, United Arab Emirates, Israel, Gulf Cooperation Council, South Africa, Ethiopia, Kenya, Egypt, Sudan, the Middle East, and Africa |
| Market Leaders Profiled | Thermo Fisher Scientific Inc. (U.S.), Promega Corporation (U.S.), Hoffmann-La Roche Ltd. (Switzerland), and QIAGEN N.V. (Netherlands). SA (France), Bio-Rad Laboratories (U.S.), Lonza Group (Switzerland), Sigma-Aldrich Corporation (U.S.), Mirus Bio LLC (U.S.), and MaxCyte Inc. (U.S.)., |
SEGMENTAL ANALYSIS
By Product Insights
The reagents segment dominated the MEA transfection reagents and equipment market and accounted for a substantial share in 2025. This supremacy of the segment is driven by the recurring nature of reagent consumption, as every transfection experiment requires fresh lipids, polymers, or viral vectors, whereas instruments are one-time capital purchases. A leading factor is the exponential growth in gene editing and functional genomics studies across the region, which rely heavily on high-efficiency chemical reagents to deliver CRISPR-Cas9 components into diverse cell lines. Furthermore, the shift toward transient protein expression for vaccine development in countries like Egypt and South Africa necessitates large-scale usage of GMP-grade transfection reagents. The versatility of modern reagents that can transfect difficult primary cells without specialized hardware also makes them the preferred choice for resource-constrained academic institutions. This combination of recurring revenue models, expanding research scopes, and the critical need for high-quality delivery molecules solidifies the reagents segment as the market leader.
The instruments segment is expected to exhibit a noteworthy CAGR of 9.4% over the forecast period. This rapid acceleration of the segment is fueled by the modernization of laboratory infrastructure and the increasing adoption of automated, high-throughput screening platforms in pharmaceutical R&D hubs across the Gulf and Israel. The main driver is the transition from manual, low-efficiency methods to standardized electroporation and microinjection systems that offer reproducible results essential for regulatory compliance in drug discovery. According to research, investment in life sciences infrastructure has surged, with new biotech incubators equipping their facilities with advanced nucleofection devices and robotic liquid handlers to attract global partnerships. The growing complexity of cell therapies requires precise physical delivery methods that chemical reagents alone cannot achieve, driving demand for specialized hardware. Additionally, the durability and long-term cost-effectiveness of instruments appeal to government-funded universities seeking to reduce recurring consumable expenses. This convergence of infrastructure investment, technological upgrading, and the need for precision in advanced therapies positions instruments as the most dynamic growth engine in the product segmentation.
By Method Insights
The biochemical method segment led the MEA transfection reagents and equipment market and captured a share of 55.7% in 2025 because of the ease of use, broad applicability across various cell types, and relatively lower toxicity compared to older techniques like calcium phosphate precipitation. One of the major driving factors is the widespread adoption of lipid nanoparticles (LNPs) following the global success of mRNA vaccines, which has validated biochemical delivery as the gold standard for both research and therapeutic applications. These methods do not require expensive specialized equipment, making them accessible to the vast majority of academic and small-scale industrial labs in the region. The ability of modern biochemical reagents to deliver large genetic constructs and RNA molecules with minimal optimization further cements their position. This blend of accessibility, proven efficacy, and alignment with global therapeutic trends ensures that biochemical methods remain the workhorse of transfection in the Middle East and Africa.
The physical method segment is predicted to witness the highest CAGR of 10.2% from 2026 to 2034, owing to the increasing need to transfect hard-to-transfect primary cells, stem cells, and immune cells that are resistant to chemical methods, particularly in the burgeoning field of cell and gene therapy. A key factor propelling this growth is the expansion of regenerative medicine programs in countries like Israel and Turkey, where researchers are developing CAR-T cell therapies and personalized cancer treatments that demand high-efficiency physical delivery. The development of novel microfluidic electroporation devices that offer higher cell viability and throughput is also attracting interest from pharmaceutical companies scaling up production. Furthermore, the ability of physical methods to bypass cellular barriers without the potential immunogenicity of viral vectors makes them increasingly attractive for therapeutic applications. This alignment with cutting-edge clinical research and the need for versatile delivery solutions positions physical methods as the most rapidly expanding segment.
By Application Insights
The biomedical research application segment was the largest in the MEA transfection reagents and equipment market and occupied a significant share in 2025. This prominence of the segment is attributed to the vast network of universities, government research institutes, and hospital-based laboratories across the region that are actively investigating genetic diseases, infectious pathogens, and basic cellular mechanisms. The top reason behind this growth is the high prevalence of region-specific genetic disorders such as thalassemia, sickle cell anemia, and consanguinity-related conditions, which necessitate extensive functional genomics research to understand pathogenesis and develop targeted therapies. Furthermore, the fight against endemic infectious diseases like malaria and tuberculosis in Africa relies heavily on transfection technologies to study host-pathogen interactions and validate drug targets. The sheer volume of academic publications and thesis projects emerging from the region reflects this intense research activity. This deep-rooted commitment to understanding local health challenges through molecular biology ensures that biomedical research remains the primary revenue generator for the transfection market.
The protein production application segment is estimated to register the fastest CAGR of 11.8% between 2026 and 2034. This swift expansion of the segment is fuelled by the strategic push toward local biomanufacturing of biologics, biosimilars, and vaccines to ensure health security and reduce reliance on imports. The establishment of new facilities in Egypt, Morocco, and Saudi Arabia, which utilize mammalian cell platforms for rapid and scalable transient transfection, is the core factor propelling this segment. The success of mRNA vaccine technology has further highlighted the importance of efficient protein production workflows, prompting investments in optimized transfection protocols for antigen synthesis. Additionally, the rising demand for diagnostic reagents and enzymes produced locally supports this trend. This structural shift from pure research to industrial application creates a vibrant new channel for transfection technologies, offering high growth potential as the region scales up its bioprocessing capabilities.
By End User Insights
The academic and research institutes segment held the majority share of 65.5% of the MEA transfection reagents and equipment market in 2025. This dominance of the segment is supported by the dense concentration of public universities, national research centers, and medical schools that form the backbone of scientific inquiry in the region. Significant government-funded research initiatives, aimed at mitigating local health challenges and enhancing human capital in the life sciences, constitute the primary driving factor. These institutions consume vast quantities of transfection reagents for student training, doctoral research, and large-scale collaborative projects. The presence of international branch campuses and partnerships with Western universities further amplifies the adoption of standard transfection protocols. Furthermore, academic labs often serve as incubators for startups, creating a downstream effect on technology adoption. This robust ecosystem of publicly funded science ensures that academic and research institutes remain the primary customers for transfection products in the Middle East and Africa.
The pharmaceutical and biotechnology companies segment is anticipated to witness the fastest CAGR of 12.5% from 2026 to 2034. This quick growth of the segment is propelled by the rapid maturation of the regional biotech industry, characterized by the emergence of homegrown biopharma firms and the expansion of multinational corporations into local manufacturing and R&D. The main factor driving this growth is the increasing focus on developing novel biologics, gene therapies, and vaccines within the region, which requires industrial-scale transfection processes for lead optimization and clinical material production. Besides, the shift toward contract development and manufacturing organizations (CDMOs) in the region also contributes to this growth, as these entities require flexible and efficient transfection platforms to serve diverse clients. The alignment with national visions to localize healthcare supply chains ensures a steady stream of capital investment into bioprocessing infrastructure. This transition from academic discovery to commercial development positions pharmaceutical and biotech companies as the most dynamic growth engine for the transfection market.
COUNTRY LEVEL ANALYSIS
Saudi Arabia Transfection Reagents And Equipment Market Analysis
Saudi Arabia outperformed other countries in the MEA transfection reagents and equipment market and accounted for a 28.8% share in 2025. The country’s growth is driven by the rapid development of specialized economic cities like KAUST and KACST, which serve as hubs for advanced genomic research and biotechnology innovation. The primary driving factor is the kingdom's commitment to the localization of healthcare and pharmaceutical manufacturing, which has spurred the establishment of numerous biotech startups and research centers focused on gene therapy and personalized medicine. The high prevalence of genetic diseases in the population further fuels academic and clinical research requiring sophisticated gene delivery systems. In addition, the government's willingness to fund high-risk, high-reward research projects ensures a steady flow of capital for acquiring premium reagents and instruments. This combination of strategic vision, financial backing, and demographic necessity ensures Saudi Arabia remains the most lucrative and influential market for transfection technologies in the region.
Israel Transfection Reagents And Equipment Market Analysis
Israel was the second largest country in the MEA transfection reagents and equipment market and occupied a 22.5% share in 2025. This expansion of the Israeli market is attributed to its globally recognized reputation as a powerhouse for biotechnology innovation and startup creation. The market status here is defined by a highly mature ecosystem where academic research seamlessly translates into commercial ventures, driving demand for cutting-edge transfection solutions for drug discovery and therapeutic development. A key driving factor is the dense concentration of biotech firms and pharmaceutical R&D centers that specialize in oncology, immunology, and gene editing, all of which rely heavily on efficient gene delivery methods. The country's strong emphasis on intellectual property and clinical trials accelerates the pace of research, necessitating high-throughput and automated transfection platforms. Moreover, the collaboration between universities and industry ensures that research findings quickly move into development phases, sustaining a robust market for both academic and industrial transfection products. This culture of innovation and commercialization makes Israel a critical premium market for advanced transfection technologies.
South Africa Transfection Reagents And Equipment Market Analysis
South Africa holds a significant share of the MEA market by serving as the most developed scientific hub on the African continent and a gateway for sub-Saharan operations. The market status is bifurcated, with a sophisticated private biotech sector driving demand for high-end instruments and a vibrant public academic sector consuming large volumes of reagents for infectious disease and genetic research. The primary driving factor is the country's strong tradition in medical research, supported by institutions like the SAMRC and CSIR, which lead continental efforts in vaccine development and genomics. In addition, the recent establishment of mRNA vaccine manufacturing capabilities has further amplified the demand for lipid nanoparticles and related delivery systems. The presence of multinational pharmaceutical companies with regional headquarters in Johannesburg also contributes to the market, bringing global standards and procurement practices. This dual strength in academic excellence and emerging industrial capacity ensures South Africa remains a pivotal player in the African transformation landscape.
United Arab Emirates Transfection Reagents And Equipment Market Analysis
The United Arab Emirates witnessed a consistent growth in the MEA market owing to its strategic focus on becoming a global hub for medical tourism, biotechnology, and precision medicine. The market status is defined by heavy government investment in futuristic healthcare infrastructure, including the Dubai Science Park and Abu Dhabi Global Market, which attract international biotech firms and research collaborations. A major driving factor is the national strategy to diversify the economy away from oil by fostering knowledge-based industries, leading to significant subsidies and incentives for life sciences companies. The presence of world-class hospitals conducting clinical trials further boosts the market, as these facilities require GMP-grade materials for investigational products. Moreover, the country's role as a logistics hub also facilitates the import and distribution of temperature-sensitive reagents to neighboring regions. This proactive policy environment and strategic positioning make the UAE a high-growth market for next-generation transfection technologies.
Egypt Transfection Reagents And Equipment Market Analysis
Egypt is likely to expand notably in the MEA market from 2026 to 2034, driven by its large population, extensive network of universities, and ambitious plans to revitalize its pharmaceutical and biotechnology sectors. The market status is characterized by a high volume of academic research activities combined with a growing industrial base focused on generic biologics and vaccine production. The primary driving factor is the government's "Vision 2030," which prioritizes local manufacturing of medicines and the development of a robust biotech industry to ensure health security. The recent partnership with international organizations to establish mRNA vaccine technology transfer hubs has created a new wave of demand for lipid-based delivery systems and related equipment. Besides, the sheer scale of the student population and the increasing focus on postgraduate research further amplify consumption. This combination of demographic weight, educational depth, and industrial ambition positions Egypt as a high-potential market for volume-driven growth in the transfection sector.
COMPETITIVE LANDSCAPE
The competition in the MEA transfection reagents and equipment market is characterized by a dynamic interplay between global giants and emerging regional players vying for dominance through innovation and localized strategies. Major corporations leverage their extensive resources to introduce advanced lipid nanoparticles and automated electroporation systems that cater to high-end private laboratories and biotechnology hubs in Israel and the Gulf. Intense rivalry exists in the public sector, where price sensitivity drives competition toward cost-effective chemical reagents and durable instruments that meet basic research standards. Companies constantly strive to differentiate their offerings through superior transfection efficiency, low cytotoxicity profiles, and comprehensive technical support programs. The market sees frequent strategic alliances with local distributors to overcome logistical hurdles and navigate diverse regulatory requirements across numerous countries. Price competition remains fierce in commoditized segments, forcing manufacturers to optimize supply chains and explore local manufacturing opportunities to maintain margins. Regulatory compliance acts as a significant barrier to entry, favoring established players with robust quality management systems and clinical data portfolios. Customer loyalty is built through long-term relationships with university procurement departments and key opinion leaders who influence purchasing decisions. This complex environment fosters continuous adaptation as participants balance the need for cutting-edge technology with the economic realities of developing research ecosystems across the vast Middle East and African continent.
KEY MARKET PLAYERS
The leading companies in the MEA Transfection Reagents and Equipment Market profiled in the report are
- Thermo Fisher Scientific Inc.
- Promega Corporation
- F. Hoffmann-La Roche Ltd.
- QIAGEN N.V.
- Polyplus-transfection SA
- Bio-Rad Laboratories Inc.
- Lonza Group
- Sigma-Aldrich Corporation
- Mirus Bio LLC
- MaxCyte Inc.
TOP LEADING PLAYERS IN THE MARKET
- Thermo Fisher Scientific stands as a preeminent force in the MEA transfection reagents and equipment market through its comprehensive portfolio, including Gibco and Invitrogen brands. The company leverages its global scale to introduce advanced lipid nanoparticles and electroporation systems tailored for diverse research needs. Recent actions include strategic partnerships with regional distributors to expand access in remote African nations and the launch of localized training programs in Saudi Arabia to enhance researcher proficiency. Thermo Fisher actively invests in clinical education initiatives that demonstrate the safety and efficacy of its reagents in gene therapy and vaccine development. Their commitment to innovation drives the development of serum-free formulations that reduce cytotoxicity during sensitive experiments. By establishing regional hubs in Dubai and Johannesburg, the company ensures robust supply chain resilience and rapid response to market demands. This holistic approach solidifies their leadership position by addressing both the high-end private sector needs and the volume requirements of public research systems across the Middle East and Africa.
- Merck KGaA operates as a critical supplier in the MEA transfection reagents and equipment market via its MilliporeSigma and Sigma Aldrich brands,s which are synonymous with quality and reliability in life science research. The company utilizes its extensive distribution network to deliver a wide array of chemical and viral-based transfection solutions to laboratories throughout the Gulf and Sub-Saharan Africa. Recent strategic moves involve the introduction of next-generation polymer-based reagents designed to handle difficult primary cells common in regional genetic studies. Merck KGaA has expanded its footprint by collaborating with government health ministries to support local vaccine manufacturing initiatives in Egypt and South Africa. Their focus on sustainability drives the optimization of packaging to reduce laboratory waste while maintaining product sterility. The company actively sponsors scientific conferences and workshops to train the next generation of molecular biologists on advanced gene delivery techniques. Merck KGaA is strengthening its role as a trusted partner through a focus on product availability and technical support. This commitment ensures better research outcomes and wider access to advanced tools throughout the MEA region.
- Danaher Corporation distinguishes itself in the MEA transfection reagents and equipment market through its dedication to high-quality innovations under its Beckman Coulter and Cytiva subsidiaries. The company offers a specialized range of automated liquid handling systems and electroporation devices that appeal to high-throughput screening facilities while maintaining rigorous performance standards. Recent actions include the expansion of service capabilities to serve the region more efficiently and the launch of integrated workflows that combine reagents with optimized instrument protocols. Danaher aggressively invests in local assembly projects in the United Arab Emirates to comply with regional localization mandates and reduce import costs. Their commitment to education is evident in the establishment of application centers that allow researchers to validate methods before purchasing equipment. The company leverages its strong presence in diagnostics to cross-sell transfection products to existing hospital and laboratory clients. Danaher maintains a competitive edge by focusing on value-based science and reliable supply chains. In turn, they drive growth through trust and long-term stakeholder relationships in the dynamic MEA market.
TOP STRATEGIES USED BY KEY MARKET PARTICIPANTS
Key players in the MEA transfection reagents and equipment market primarily employ strategic partnerships with local distributors to navigate complex regulatory landscapes and ensure widespread product availability. Companies heavily invest in research, educatio,n and training programs to build brand loyalty and demonstrate the clinical benefits of advanced gene delivery systems. Product localization through regional assembly or packaging helps manufacturers comply with government mandates and reduce costs for price-sensitive markets. Many participants focus on expanding their portfolios to include both premium disposable reagents for private labs and durable equipment options for public sector tenders. Digital integration, such as smart instruments with data connectivity, serves as a differentiation strategy to attract top-tier research centers. Expanding into emerging economies through targeted marketing and affordable pricing models allows firms to tap into untapped research populations. These combined approaches enable market leaders to overcome infrastructure challenges and drive the adoption of modern biotechnologies across the diverse Middle East and Africa region.
MARKET SEGMENTATION
This research report is segmented and sub-segmented into the following categories
By Product
- Reagents,
- Instruments
By Method
- Biochemical,
- Calcium Phosphate,
- Physical,
- Viral
By Application
- Biomedical Research,
- Protein Production,
- Therapeutic Delivery
By End User
- Academic & Research Institutes,
- Pharmaceutical & Biotechnology Companies
By Country
- KSA,
- UAE,
- Israel,
- the rest of the GCC countries,
- South Africa,
- Ethiopia,
- Kenya,
- Egypt,
- Sudan,
- rest of MEA
Related Reports
Access the study in MULTIPLE FORMATS
Purchase options starting from
$ 1600
Didn’t find what you’re looking for?
TALK TO OUR ANALYST TEAM
Need something within your budget?
NO WORRIES! WE GOT YOU COVERED!
Call us on: +1 888 702 9696 (U.S Toll Free)
Write to us: sales@marketdataforecast.com