North America Phenol Market Size, Share, Trends & Growth Forecast, Segmented By End-User And By Country (The USA, Canada, Mexico and Rest of North America), Industry Analysis From 2025 to 2033
North America Phenol Market Size
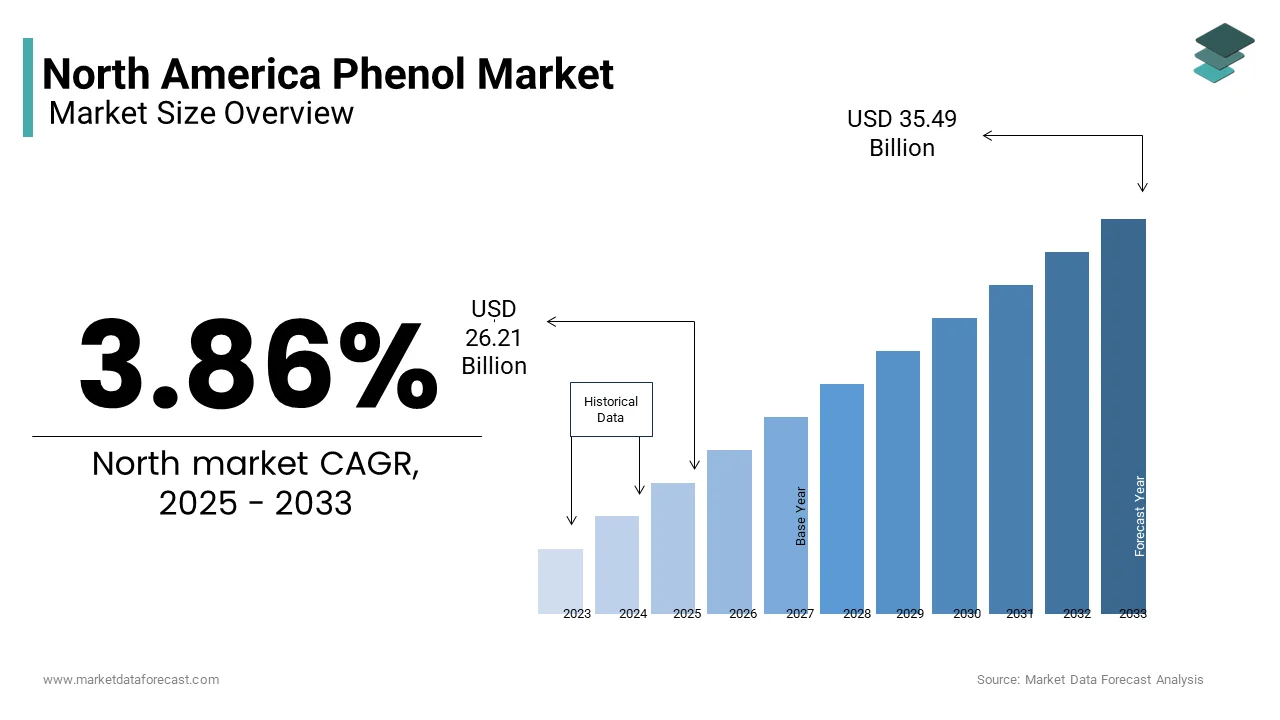
The North America Phenol market size was valued at USD 25.24 billion in 2024 and is anticipated to reach USD 26.21 billion in 2025 from USD 35.49 billion by 2033, growing at a CAGR of 3.86% during the forecast period from 2025 to 2033.
MARKET DRIVERS
Rising Demand for Bisphenol A (BPA)
The demand for Bisphenol A, a primary derivative of phenol, has been a pivotal driver for the North American phenol market. Accounting for a significant portion of phenol consumption, BPA is indispensable in the production of polycarbonate plastics and epoxy resins. The automotive sector's increasing reliance on lightweight materials further amplifies BPA usage, with the U.S. automotive industry projected to grow further in the coming years. Additionally, the packaging sector, which consumes a notable percentage of global BPA, witnessed a 5% surge in demand during 2022. This consistent rise underscores the importance of BPA as a growth catalyst for phenol producers, propelling market expansion across the region.
Growth in Construction and Infrastructure Development
Phenolic resins, another significant application of phenol, are witnessing unprecedented demand due to construction activities. These developments have led to an increase in phenolic resin production in the past few years. Such trends affirm that infrastructure development remains a critical factor driving the phenol market forward.
MARKET RESTRAINTS
Stringent Environmental Regulations
Environmental regulations pose a significant challenge to the North American phenol market, particularly concerning emissions and waste management. The Environmental Protection Agency mandates strict limits on benzene emissions, a precursor to phenol, compelling manufacturers to adopt costly pollution control technologies. Furthermore, public scrutiny over BPA's potential health risks has led to bans in certain states, reducing demand considerably. These regulatory pressures create operational hurdles, limiting market growth and necessitating innovation in safer alternatives.
Volatility in Feedstock Prices
The phenol market is highly sensitive to fluctuations in benzene and propylene prices, which constitute a noticeable share of production costs. Like crude oil price volatility significantly impacted benzene prices in 2022, directly affecting phenol manufacturers. Similarly, disruptions in natural gas supply chains, especially in Canada, escalated propylene costs by 10%, according to the Canadian Energy Regulator. This instability forces companies to absorb higher expenses or pass them on to consumers, thereby dampening market expansion. Such economic uncertainties remain a persistent restraint, challenging the industry's sustainability.
MARKET OPPORTUNITIES
Expansion into Renewable Energy Applications
The shift toward renewable energy presents a lucrative opportunity for the North American phenol market. Phenolic resins are increasingly utilized in wind turbine blades due to their exceptional thermal stability and mechanical strength. Additionally, solar panel manufacturers are exploring phenolic-based adhesives, which could account for a notable share of the adhesive business by 2026. By aligning with green energy initiatives, phenol producers can tap into a rapidly expanding segment, ensuring long-term profitability.
Advancements in Bio-Based Phenol Production
Bio-based phenol production is emerging as a transformative opportunity, which is driven by the need for sustainable alternatives. Companies like Genomatica have pioneered bio-phenol derived from renewable feedstocks, achieving a major reduction in carbon emissions. The global bio-based chemicals landscape is predicted to further expand in the next few years, with North America holding a considerable share.
MARKET CHALLENGES
Supply Chain Disruptions
Supply chain disruptions have emerged as a pressing challenge for the North American phenol market. The COVID-19 pandemic exposed vulnerabilities, leading to a decline in benzene imports. Geopolitical tensions, such as the Russia-Ukraine conflict, further exacerbated shortages, causing a spike in raw material costs. These interruptions force manufacturers to operate below capacity is hindering timely deliveries and eroding customer trust. Addressing these logistical complexities requires strategic investments in localized sourcing and inventory management systems.
Intense Market Competition
The phenol market faces stiff competition from low-cost imports, particularly from Asia. China contributes significantly to phenol exports by accounting for a considerable share of global trade, and has intensified price wars. In 2023, North American producers faced pressure to lower prices to remain competitive and squeeze profit margins. Besides, the proliferation of substitute materials, such as bio-based alternatives, threatens traditional phenol applications. Navigating this competitive landscape demands innovation and differentiation to sustain market share amidst growing external pressures.
REPORT COVERAGE
| REPORT METRIC | DETAILS |
| Market Size Available | 2024 to 2033 |
| Base Year | 2024 |
| Forecast Period | 2025 to 2033 |
| CAGR | 4.23% |
| Segments Covered | By End-Use and Country |
| Various Analyses Covered | Global, Regional, and country-level analysis; Segment-Level Analysis, DROC, PESTLE Analysis, Porter’s Five Forces Analysis, Competitive Landscape, Analyst Overview of Investment Opportunities |
| Country's Covered | The United States, Canada, and the Rest of North America |
| Market Leaders Profiled | INEOS Phenol Gmbh, CEPSA Química S.A. (Compañía Española de Petróleos S.A.U.), Mitsui Chemicals Inc., Formosa Chemicals & Fibre Corporation, Kumho P & B Chemicals Inc. (Kumho Petrochemical Co. Ltd.), Shell Chemicals (Shell plc) |
SEGMENTAL ANALYSIS
By End-Use Insights
The segment of bisphenol A commanded the largest share of the North American phenol market, i.e., 45.5% of total consumption in 2024. Also, their dominance is attributed to their critical role in producing polycarbonate plastics and epoxy resins, which are integral to industries like automotive, electronics, and packaging. The automotive sector alone contributes notably to BPA demand, driven by the need for lightweight materials to enhance fuel efficiency. Furthermore, the packaging industry's reliance on BPA-based coatings has grown in recent years. These factors strengthen BPA's position as the market leader, supported by its versatility and widespread applications.
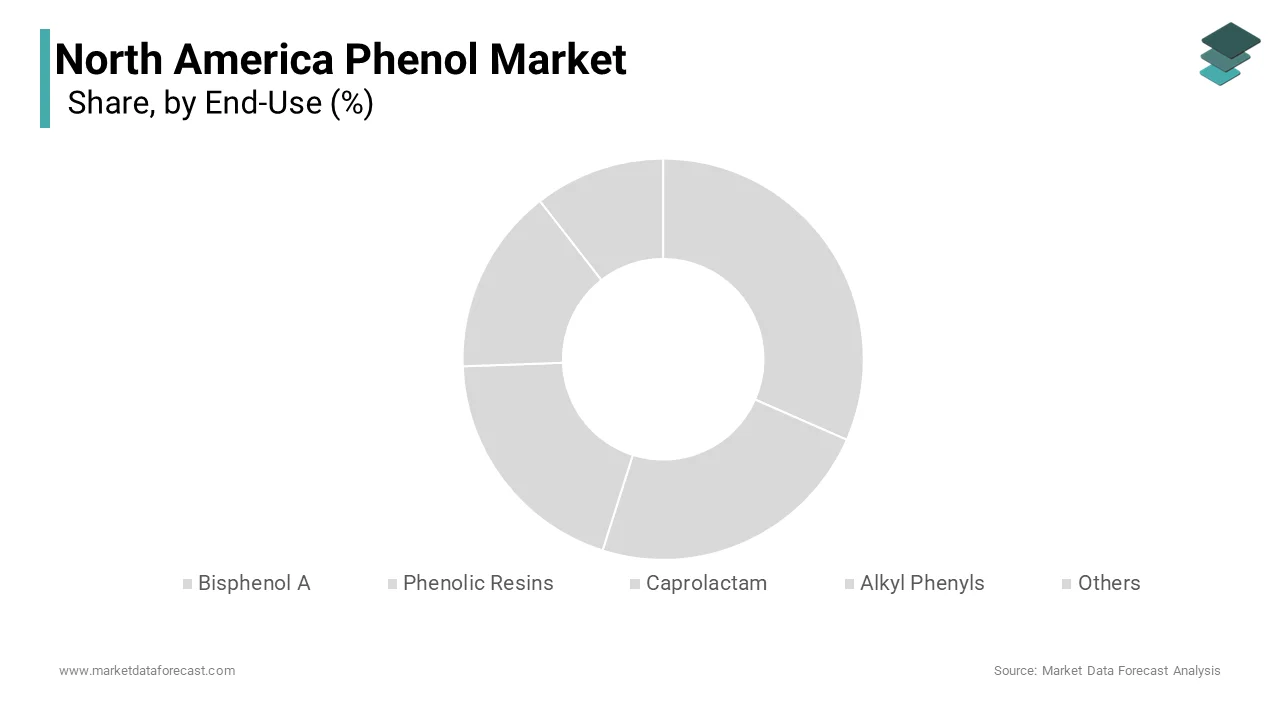
The alkyl phenyls segment is the fastest-growing by registering a CAGR of 6.5% from 2025 to 2023. This growth is fueled by rising demand for surfactants and detergents. The shift toward eco-friendly cleaning products has further accelerated adoption, with biodegradable surfactants witnessing a notable increase in sales. Additionally, the cosmetics industry's preference for alkyl phenyl derivatives in emulsifiers has expanded their application scope, driving rapid market expansion.
COUNTRY LEVEL ANALYSIS
United States Phenol Market Analysis
The United States is the undisputed leader in the North American phenol market by commanding a 75.4% share in 2024. This dominance is backed by the country's robust petrochemical infrastructure and strategic investments in advanced manufacturing technologies. The U.S. benefits from abundant shale gas reserves, which provide a cost-effective feedstock for benzene production, a critical precursor to phenol. Furthermore, the nation’s industrial landscape drives significant demand across key sectors such as automotive, construction, and packaging. For instance, the automotive sector, which makes up a considerable share of phenol consumption, is transforming with the rise of electric vehicles (EVs). Additionally, the $1 trillion infrastructure bill passed by the U.S. government has spurred construction activities, boosting demand for insulation materials and laminates made from phenolic resins.
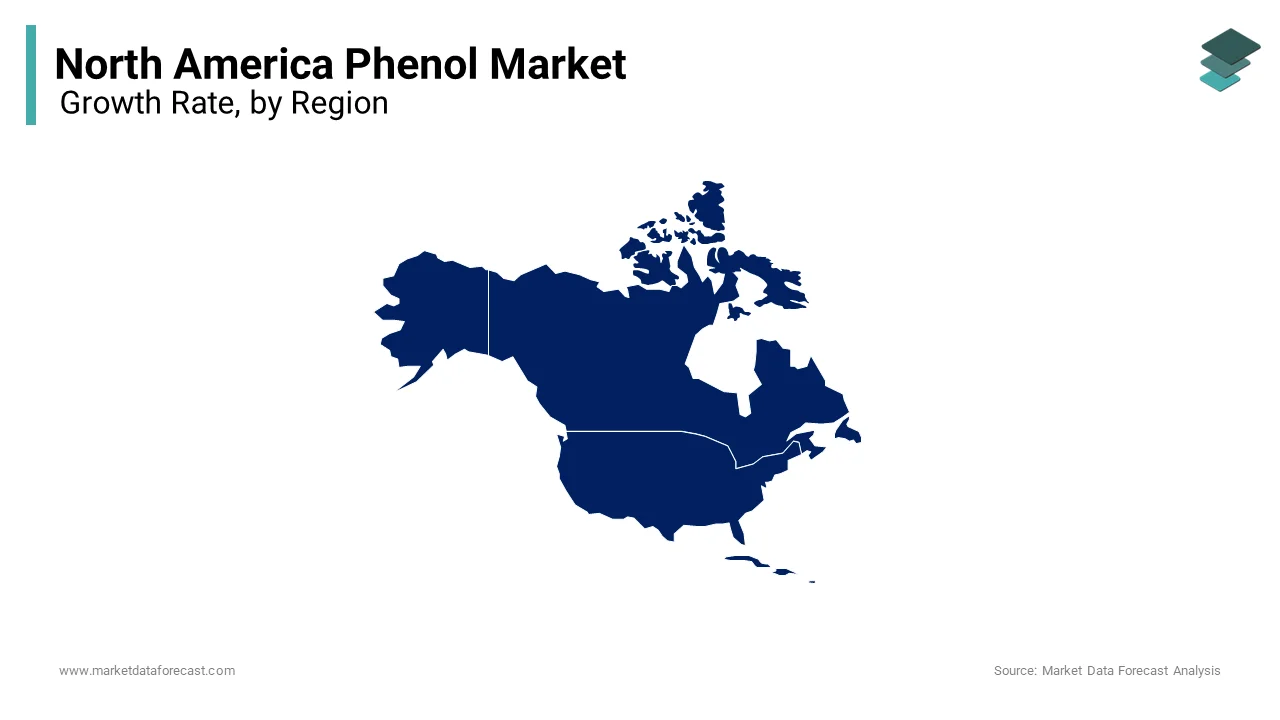
Canada Phenol Market Analysis
Canada holds a notable share of the North American phenol market, leveraging its vast natural gas reserves to produce benzene, a primary feedstock for phenol. Similarly, the country ranks among the key global producers of natural gas, providing a competitive advantage in feedstock availability. Canada’s focus on sustainability has positioned it as a pioneer in bio-based phenol research, with a substantial amount invested in green chemistry initiatives in the past few years. This emphasis on eco-friendly alternatives aligns with growing consumer demand for sustainable products. The construction sector, which consumes a key portion of phenolic resins in Canada, has seen steady growth due to federal infrastructure spending. In addition, public infrastructure projects have driven a significant increase in phenolic resin demand in recent years. Moreover, Canada’s strategic trade agreements with the U.S. and Mexico enhance its access to broader North American markets, fostering further expansion.
Mexico Phenol Market Analysis
Mexico accounts for a smaller but important share of the North American phenol market, which is driven by its rapidly expanding manufacturing base and favourable trade policies. Likewise, the country exported a substantial amount of automotive products in recent years, with the automotive sector contributing greatly to phenol demand. The shift toward lightweight materials in vehicle manufacturing has bolstered the use of BPA-based polycarbonates and phenolic resins. Additionally, Mexico’s participation in free trade agreements, such as the United States-Mexico-Canada Agreement (USMCA), facilitates seamless access to North American markets, enabling manufacturers to scale operations efficiently. The packaging industry, another key driver, has experienced a decent growth rate in phenol consumption. This growth is fueled by rising demand for durable and lightweight packaging solutions. Mexico’s strategic geographic location and cost-effective labor force further reinforce its position as a vital contributor to the regional phenol market.
COMPETITIVE LANDSCAPE
North American phenol market is characterized by intense competition, with established players and new entrants vying for market share. Established companies like Dow Inc., INEOS Phenol, and Shell Chemicals dominate the landscape, leveraging their scale, technological expertise, and brand reputation to maintain leadership. However, the entry of smaller firms specializing in bio-based phenols introduces fresh competition, particularly in eco-conscious segments. Price wars often arise due to the influx of low-cost imports from Asia, forcing companies to adopt cost-saving measures or differentiate their offerings. Additionally, stringent environmental regulations and the need for sustainable practices add complexity, compelling firms to innovate continuously. Despite these challenges, the market remains resilient, driven by strategic investments and a focus on meeting diverse industrial needs.
KEY MARKET PLAYERS
The market players that are dominating the North American phenol market include
- INEOS Phenol GmbH
- Dow Inc.
- CEPSA Química S.A. (Compañía Española de Petróleos S.A.U.)
- Mitsui Chemicals Inc.
- Formosa Chemicals & Fibre Corporation
- Kumho P & B Chemicals Inc. (Kumho Petrochemical Co. Ltd.)
- Shell Chemicals (Shell plc)
Top Players In The Market
- Dow Inc. is a global powerhouse in the phenol market, contributing significantly to North America’s production capacity. The company operates state-of-the-art integrated manufacturing facilities, ensuring cost efficiency and supply chain resilience. Its strong R&D capabilities and partnerships with industries like automotive and electronics enable Dow to maintain its leadership position.
- INEOS Phenol specializes in high-purity phenol tailored for niche applications. The company’s strategic collaborations with leading automotive manufacturers show its commitment to innovation. Additionally, INEOS invests heavily in research to enhance product quality and expand its application scope. Its focus on customer-centric solutions and operational excellence ensures sustained growth in a competitive market.
- Shell Chemicals is leveraging its expertise in benzene production to maintain a competitive edge. The company’s commitment to sustainability is evident in its substantial investment in renewable feedstock research. Shell’s bio-based phenol initiatives target emerging markets, including eco-friendly packaging and green construction materials. Its strategic partnerships with downstream industries ensure a steady demand pipeline, while its global presence enhances market reach. Shell Chemicals’ emphasis on innovation and sustainability positions it as a key player in the evolving phenol landscape.
Top Strategies Used By Key Market Participants
Key players in the North American phenol market employ a range of strategies to maintain their competitive edge and drive growth. One prominent approach is vertical integration, which allows companies to streamline operations and reduce dependency on external suppliers. For instance, Dow Inc. operates integrated benzene-to-phenol production facilities, minimizing costs and enhancing supply chain reliability. Another critical strategy is investing in research and development (R&D) to innovate sustainable products. INEOS Phenol, for example, collaborates with automotive giants to develop lightweight materials, addressing the growing demand for fuel-efficient vehicles. Sustainability initiatives are also a focal point, with Shell Chemicals spearheading bio-based phenol projects to meet regulatory requirements and consumer preferences. Strategic partnerships and acquisitions further strengthen market positions, enabling companies to expand their portfolios and tap into new application areas.s
RECENT MARKET NEWS
- In June 2023, Dow Inc. launched a bio-based phenol pilot plant, marking a significant step toward sustainable production and enhancing its portfolio of eco-friendly products.
- In March 2023, INEOS Phenol partnered with BMW to co-develop lightweight automotive components using advanced phenolic resins, addressing the automotive industry’s demand for fuel-efficient materials.
- In January 2023, Shell Chemicals announced a $500 million investment in renewable feedstock research, aiming to produce bio-based phenols and align with global sustainability goals.
- In October 2022, Covestro acquired a phenolic resin facility in Texas, expanding its production capacity and strengthening its position in the North American market.
- In July 2022, BASF introduced a low-emission phenol derivative designed for eco-conscious consumers, targeting applications in green construction and sustainable packaging.
MARKET SEGMENTATION
This research report on the North American phenol market is segmented and sub-segmented into the following categories.
By End-Use
- Bisphenol A
- Phenolic Resins
- Caprolactam
- Alkyl Phenyls
- Others
By Country
- United States
- Canada
- Mexico
- Rest of North America
Frequently Asked Questions
What is phenol, and why is it important industrially?
Phenol (C₆H₅OH) is a key aromatic organic compound primarily used to produce bisphenol-A (BPA), phenolic resins, caprolactam (for nylon-6), and disinfectants. It’s a critical building block in plastics, adhesives, and pharmaceuticals.
What’s driving demand for phenol in North America?
Steady growth in end-use sectors—especially automotive (lightweight composites), construction (insulation, plywood adhesives), and electronics (epoxy resins for PCBs)—supports phenol consumption, alongside recovery in manufacturing post-pandemic.
Which derivatives account for the largest share of phenol use?
Bisphenol-A (~40%) and phenolic resins (~30%) dominate, with caprolactam and alkylphenols making up most of the remainder—driven by demand for polycarbonates, flame-retardant materials, and high-performance polymers.
How is the shift away from BPA affecting the market?
While BPA-free alternatives are growing in food-contact applications, overall BPA demand remains strong in non-food sectors (e.g., automotive glazing, electronics), limiting major disruption—though producers are diversifying into non-BPA derivatives.
Who are the major phenol producers in North America?
Key players include INEOS Phenol, Shell Chemicals, SI Group, Honeywell (via joint ventures), and Formosa Plastics—most operating integrated cumene-to-phenol/acetone plants to optimize economics and supply stability.
What role does the acetone co-product play in market dynamics?
Phenol is predominantly produced via the cumene process, yielding ~0.6 tons of acetone per ton of phenol—making acetone demand (e.g., for MMA, solvents) a critical factor in plant utilization and pricing balance.
How are sustainability trends influencing phenol production?
Producers are investing in energy-efficient processes, circular feedstocks (e.g., bio-cumene R&D), and closed-loop systems to reduce emissions—aligning with customer ESG goals and regulatory pressure (e.g., EPA risk evaluations).
Are supply chain vulnerabilities a concern?
Yes—tight phenol capacity, reliance on a few large-scale plants, and logistics constraints (e.g., rail, barge) can lead to regional shortages, especially during turnarounds or extreme weather events.
How do regulations impact the phenol market?
Phenol is listed under TSCA and subject to EPA scrutiny for toxicity; workplace exposure limits (OSHA PEL) and handling protocols drive safety investments, while REACH-like state regulations (e.g., California Prop 65) affect downstream formulation.
What’s the market outlook for 2025–2030?
The North America phenol market is expected to grow modestly, supported by resilient demand in construction and automotive—though innovation in bio-based alternatives and regulatory developments will shape long-term competitiveness.
Related Reports
Access the study in MULTIPLE FORMATS
Purchase options starting from
$ 2000
Didn’t find what you’re looking for?
TALK TO OUR ANALYST TEAM
Need something within your budget?
NO WORRIES! WE GOT YOU COVERED!
Call us on: +1 888 702 9696 (U.S Toll Free)
Write to us: sales@marketdataforecast.com