- Product Description Description
- Table of Contents TOC
- List of Table & Figure LOT
- Get Free Sample PDF Sample PDF
Market Size, 2025
$37.95 BnMarket Estimate, 2026
$40.38 BnMarket Forecast, 2034
$66.38 BnCAGR, 2026–2034
6.41%U.S. Shale Gas Market Report Summary
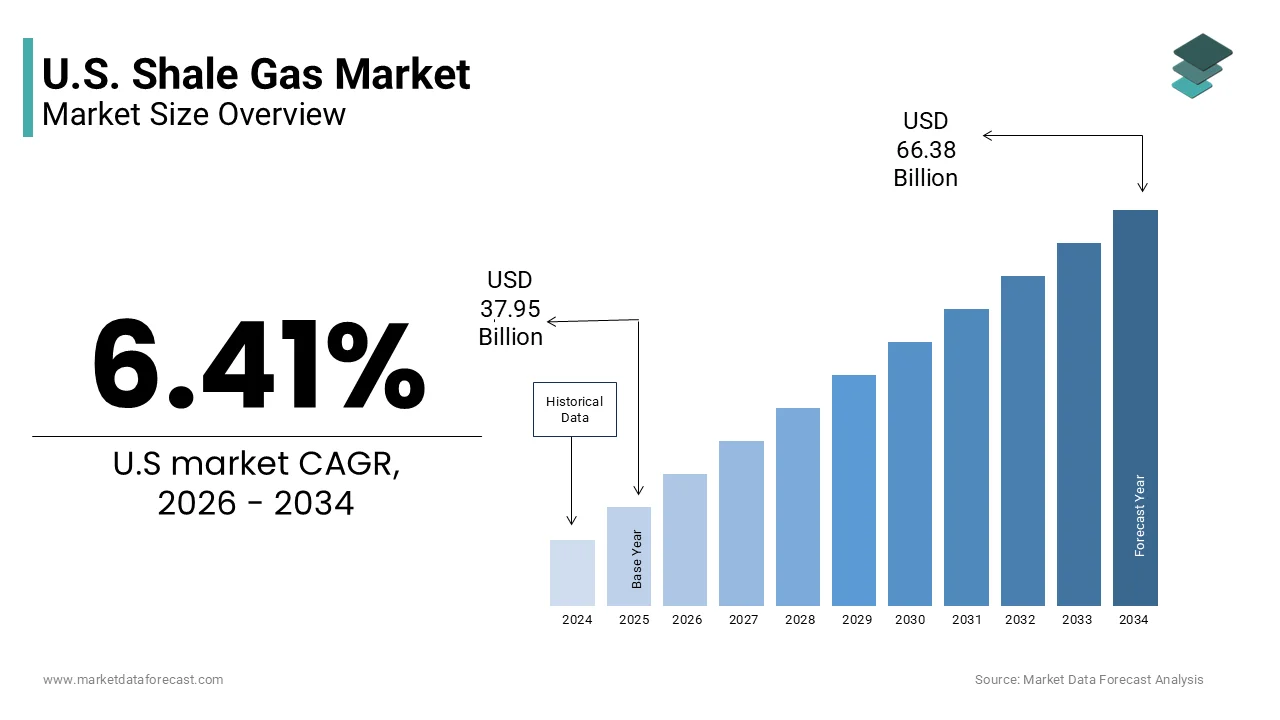
The U.S. shale gas market was valued at USD 37.95 billion in 2025, is estimated to reach USD 40.38 billion in 2026, and is projected to reach USD 66.38 billion by 2034, growing at a CAGR of 6.41% during the forecast period. Market growth is driven by increasing natural gas demand, technological advancements in hydraulic fracturing and horizontal drilling, and the country's abundant shale reserves. Shale gas has become a key component of the U.S. energy mix due to its cost competitiveness, domestic availability, and role in supporting energy security. Growing demand from power generation, industrial applications, and export markets is further supporting market expansion.
Key Market Trends
- Increasing domestic and international demand for natural gas is driving market growth.
- Advancements in drilling and hydraulic fracturing technologies are improving production efficiency.
- Growing investments in liquefied natural gas export infrastructure are boosting market expansion.
- Rising focus on energy security and domestic resource utilization is supporting industry development.
- Innovation in extraction technologies and operational optimization is influencing market growth.
Segmental Insights
- Based on application, the automotive segment accounted for 63.6% of the market share in 2025 according to the provided data. The segment's growth is supported by increasing interest in natural gas based transportation solutions and fuel diversification initiatives.
Regional Insights
- The United States accounted for 80.5% of the global shale gas market share in 2025 and maintained its dominant position worldwide. Extensive shale reserves, advanced extraction technologies, and strong energy infrastructure continue to support the country's leadership in the global shale gas industry.
Competitive Landscape
The U.S. shale gas market is highly competitive, with major energy companies focusing on production optimization, reserve development, operational efficiency, and sustainability initiatives to strengthen their market position. Companies continue to invest in advanced drilling technologies and infrastructure expansion to enhance production capabilities. Prominent players in the U.S. shale gas market include Exxon Mobil Corporation, ConocoPhillips Company, Chevron Corporation, Shell PLC, Expand Energy Corporation, Equinor ASA, PetroChina Company Limited, EQT Corporation, Occidental Petroleum Corporation, BP Plc, Coterra Energy Inc., and Kolibri Global Energy Inc..
 Download Free Sample Report
U.S. Shale Gas Market Size
The U.S. shale gas market size was valued at USD 37.95 billion in 2025, and is projected to reach USD 66.38 billion by 2034 from USD 40.38 billion in 2026, growing at a CAGR of 6.41%.
Shale gas is a type of natural gas, predominantly methane, that is found trapped deep underground inside shale rock formations. This gas, extracted via hydraulic fracturing and horizontal drilling from low-permeability formations like the Marcellus, Haynesville, and Permian basins, accounts for approximately 78% of total U.S. dry natural gas output, according to the U.S. Energy Information Administration. In 2023, U.S. shale gas production averaged over 81 billion cubic feet per day, a volume that significantly exceeds total annual combined residential and commercial natural gas consumption. Federal energy assessments estimate that U.S. technically recoverable shale and tight natural gas resources exceed 1,700 trillion cubic feet, forming the backbone of an overall natural gas resource base capable of sustaining close to a century of domestic consumption. Economic impact studies estimate that the shale gas supply chain supports hundreds of thousands of direct and indirect jobs, concentrated heavily in major producing states like Texas, Pennsylvania, Louisiana, and Ohio. The abundance of low cost gas has revitalized energy intensive industries including petrochemicals, steel, and fertilizer production. Unlike conventional reservoirs, shale plays require continuous drilling and completion activity to offset steep decline curves, creating a uniquely dynamic and capital intensive production model that responds rapidly to price signals and technological innovation.
MARKET DRIVERS
Industrial Demand Revitalization Anchors Structural Consumption Growth
The resurgence of U.S. manufacturing has created a durable and expanding demand base for shale gas, and thereby boosts the growth of the United States shale gas market. This growth is particularly noticeable in the chemicals, metals, and materials sectors, which utilize the gas as both a fuel and a feedstock. According to the American Chemistry Council, billions of dollars have been invested in new and expanded Gulf Coast petrochemical projects since 2015, utilizing competitively priced domestic natural gas as both an operational fuel and a manufacturing feedstock. Government trade figures show that U.S. chemical exports—significantly supported by shale-derived polymers and basic chemicals—surpassed $150 billion annually by 2023, reflecting a robust post-2020 growth cycle driven by low domestic feedstock costs. U.S. steelmakers have heavily adopted Electric Arc Furnace (EAF) technology, which utilizes electricity and supplemental natural gas to significantly reduce carbon emissions compared to traditional coal-fired blast furnaces. Major fertilizer producers have leveraged structurally low domestic natural gas prices to optimize and expand ammonia production capacity across the U.S. Gulf Coast and Midwest regions, as highlighted in their financial disclosures. Data from the U.S. Energy Information Administration demonstrates a steady multi-year expansion in industrial natural gas consumption, driven primarily by the manufacturing and chemical subsectors. This structural shift not only insulates shale producers from residential demand seasonality but also embeds gas as a foundational input for export oriented value chains, ensuring long term offtake stability regardless of short term price volatility.
Liquefied Natural Gas Export Expansion Creates Global Demand Outlet
The commissioning of large scale liquefied natural gas export terminals along the U.S. Gulf and East Coasts has transformed domestic shale gas into a globally traded commodity, which fuels the expansion of the United States shale gas market. These developments decouple local pricing from international supply-demand dynamics. According to the U.S. Energy Information Administration, the United States exported an average of nearly 12 billion cubic feet per day of liquefied natural gas in 2023, officially surpassing Qatar and Australia to become the world's largest LNG exporter. Major U.S. export facilities, including Sabine Pass and Cameron LNG, operate primarily on long-term supply agreements with global utilities, locking in international demand that heavily incentivises domestic shale production. Department of Energy export tracking shows that the vast majority of U.S. LNG cargoes are fed by an integrated pipeline network drawing from major domestic shale plays, with regional proximity making the Permian and Haynesville basins primary suppliers to Gulf Coast terminals. In alignment with the European Union's REPowerEU framework to reduce reliance on Russian fossil fuels, European imports of U.S. liquefied natural gas more than doubled between 2021 and 2023 to balance the region's energy grid. These exports not only generate foreign exchange but also provide price support to domestic producers by creating a floor based on international netback economics. Supported by several major expansions under construction across the Gulf Coast, domestic natural gas is projected to serve as a foundational element of America's energy export profile well into the future.
MARKET RESTRAINTS
Regulatory Fragmentation and Permitting Uncertainty Impede Development Velocity
The absence of a unified federal permitting framework for shale gas infrastructure, particularly pipelines and compressor stations, has created significant project delays and cost overruns that constrain production scalability and the growth of the United States shale gas market. Regulatory history demonstrates that major interstate natural gas pipelines frequently require multiple years of multi-tiered environmental and jurisdictional reviews, as exemplified by the PennEast Pipeline project, which faced roughly seven years of regulatory hurdles and litigation prior to its ultimate cancellation. The Environmental Protection Agency's comprehensive methane rule finalized in late 2023 mandates extensive infrastructure upgrades across existing U.S. oil and gas facilities, prompting industry associations to forecast billions of dollars in collective compliance and equipment retrofit expenditures. High-volume hydraulic fracturing remains legally prohibited in states like New York and Maryland, whereas primary producing jurisdictions like Colorado and Pennsylvania manage extraction through stringent state-level setback rules and baseline emissions monitoring frameworks. Public dockets at the Federal Energy Regulatory Commission indicate that a substantial share of proposed natural gas transmission projects face formal legal interventions and public protests during NEPA reviews, frequently extending project timelines. These regulatory hurdles not only increase capital costs but also deter investment in marginal basins, forcing producers to concentrate activity in fewer, less restricted regions, thereby intensifying local environmental and community impacts while limiting national supply diversification.
Water Intensity and Community Resistance Amplify Operational Friction
High water usage and local opposition are increasing operational issues, which hampers the expansion of the United States shale gas market. The hydraulic fracturing process requires millions of gallons of water per well, presenting notable logistical, environmental, and supply management challenges that influence regional extraction operations. Water tracking metrics indicate that oil and gas operations in the Permian Basin consume vast quantities of water monthly, prompting regional efforts to expand wastewater recycling to reduce direct competition with municipal and agricultural water users in arid zones. State regulatory logs receive sporadic domestic water well complaints from landowners near drilling fields, even though peer-reviewed geological research confirms that structural failures are rare and that properly engineered well casings prevent systemic migration of fracturing fluids into drinking aquifers. Community opposition, often organized under “frack free” coalitions, has successfully delayed or blocked projects in Ohio, Colorado, and California through ballot initiatives and zoning appeals, as documented by the Sabin Center for Climate Change Law at Columbia University. Research emphasize that ongoing litigation, regulatory compliance checks, and defense against environmental citizen suits add substantial administrative and capital overhead expenses to domestic energy development projects. Additionally, produced water management remains a primary logistical challenge for the energy sector, with federal and state data indicating that domestic shale operations generate billions of barrels of highly saline wastewater annually, requiring regulated deep-well disposal or advanced desalination and recycling treatment. New developments will face higher execution risks and capital costs as community trust erodes. This decline is driven by the absence of transparent community benefit agreements and scalable water recycling infrastructure.
MARKET OPPORTUNITIES
Carbon Capture and Storage Integration Unlocks Low Carbon Gas Pathway
The integration of carbon capture and storage technology with shale gas production and processing facilities offers a transformative opportunity for the United States shale gas market. This approach aligns natural gas with decarbonization mandates while preserving its economic and energy security benefits. Global carbon capture tracking indicates that the United States leads the world in carbon capture and storage development, with a multi-billion-dollar project pipeline heavily represented by retrofits at natural gas processing facilities and hydrogen-producing steam methane reformers. Occidental Petroleum's Stratos facility in Texas is engineered to capture up to 500,000 metric tons of carbon dioxide annually, serving as a flagship industrial scale-up of Direct Air Capture technology designed to remove CO2 directly from the atmosphere. The Inflation Reduction Act's expansion of the 45Q tax credit to $85 per ton for secure geologic sequestration has significantly enhanced the economics of carbon management, prompting midstream operators across major U.S. shale basins to evaluate point-source capture retrofits. Developed via a joint venture including Chevron, Equinor, and TotalEnergies, the Bayou Bend carbon capture and storage project along the Texas Gulf Coast features an expansive geographic footprint with a total gross storage potential estimated at 1 billion metric tons of carbon dioxide. This technological convergence not only reduces the carbon intensity of gas to levels competitive with renewables on a lifecycle basis but also creates new revenue streams through federal credits and low carbon fuel standards in California and Oregon. Carbon capture transforms shale gas from a transitional fuel into a long-term decarbonization asset. This shift is driven by global buyers who increasingly demand certified low-carbon molecules.
Hydrogen Co Production from Shale Gas Enables Energy Transition Bridge
The co production of blue hydrogen from shale gas, coupled with carbon capture and storage, provides a scalable pathway to decarbonize hard to abate sectors while leveraging existing infrastructure and expertise, which is anticipated to accelerate the expansion of the United States shale gas market. The U.S. Department of Energy has committed $7 billion in federal matching funds to establish seven Regional Clean Hydrogen Hubs across the country, including major networks in the Gulf Coast and Northeast regions designed to produce low-carbon hydrogen from natural gas utilizing carbon capture systems. Air Products' advanced clean hydrogen complex in Alberta serves as a global technical blueprint for auto-thermal reforming and carbon capture integration, designed to permanently sequester millions of tons of carbon dioxide annually. Lifecycle emissions tracking indicates that blue hydrogen derived from natural gas with high-efficiency carbon capture can significantly lower carbon intensity, qualifying the production for tiered tax incentives under the Inflation Reduction Act's 45V framework. Industrial logistics and manufacturing corporations are actively exploring varied low-carbon fuel strategies, with commercial entities finalizing supply agreements for both renewable-powered green hydrogen and carbon-abated blue hydrogen to decarbonize heavy-duty transport and industrial processes. The existing pipeline network, compressor stations, and processing facilities can be repurposed for hydrogen blending or dedicated transport, reducing capital intensity. This strategic pivot allows shale operators to transition from pure gas producers to integrated low carbon energy suppliers, ensuring relevance in a net zero policy environment while monetizing stranded assets and workforce capabilities.
MARKET CHALLENGES
Methane Emissions Accountability Threatens Social and Regulatory License
Persistent methane leakage occurs across the shale gas value chain, spanning wellheads, processing plants, and pipelines, which slows down the growth of the United States shale gas market. Consequently, this continuous emission has emerged as a critical environmental and reputational vulnerability that undermines the sector’s climate credentials. According to the Environmental Protection Agency's greenhouse gas tracking, methane emissions from domestic natural gas systems represent a primary focus of federal reduction efforts, with upstream production and gathering operations accounting for the largest percentage of those emissions. Satellite and aerial monitoring initiatives led by organizations like the Environmental Defense Fund indicate that localized super-emitter events, such as unlit flares and faulty valves, drive a disproportionate share of methane emissions in the Permian Basin. Import rules under the European Union's Methane Regulation will require international oil and gas exporters to meet strict methane intensity measurement and verification standards to maintain seamless market access to Europe. The California Air Resources Board utilizes its Low Carbon Fuel Standard to assign carbon intensity scores to natural gas used in transportation, employing a credit-and-deficit market mechanism to incentivize cleaner production and supply chains. The Securities and Exchange Commission's climate disclosure framework finalized in 2024 requires large public energy companies to disclose material Scope 1 and Scope 2 greenhouse gas emissions, enhancing transparency and investor oversight regarding corporate climate risks. The market risks losing access to premium markets if it fails to implement comprehensive leak detection programs, electrify field operations, and secure third-party verification. Without these proactive measures, it also faces escalating compliance costs that erode profit margins.
Capital Discipline and Investor Pressure Constrain Reinvestment Flexibility
Intensifying pressure from institutional investors and corporate boards to prioritize free cash flow generation and shareholder returns over production growth holds back the expansion of the United States shale gas market. As a result, this shift is fundamentally altering the industry's historical reinvestment model. The Dallas Fed Energy Survey routinely highlights that capital discipline remains a core priority for exploration and production executives, who balance new drilling investments against commitments to return free cash flow to shareholders. Investment stewardship guidelines from major asset managers emphasize the importance of robust climate risk governance and long-term financial sustainability, encouraging energy executives to align corporate strategies with carbon-reduction targets. The market volatility of 2020 accelerated a structural shift in investor sentiment, steering U.S. natural gas producers away from debt-fueled volume growth toward capital efficiency and robust balance sheet management. This financial restraint forces operators to concentrate activity in core “sweet spots” with the highest returns, leaving vast portions of shale plays undeveloped and increasing per well decline rates. Global energy shifts demonstrate that while upstream production can adapt to market signals, the speed of international emergency response is heavily dictated by long-term infrastructure capacities and regional pipeline networks. The U.S. shale gas market will remain supply constrained without a structural shift in investor expectations or new private capital pools to fund growth. If these changes do not occur, the U.S. will cede global market share to less disciplined producers and undermine its energy security objectives.
REPORT COVERAGE
| REPORT METRIC | DETAILS |
| Market Size Available | 2025 to 2034 |
| Base Year | 2025 |
| Forecast Period | 2026 to 2034 |
| CAGR | 6.41% |
| Segments Covered | By Application and Region. |
| Various Analyses Covered | Global, Regional and Country-Level Analysis, Segment-Level Analysis, Drivers, Restraints, Opportunities, Challenges; PESTLE Analysis; Porter’s Five Forces Analysis, Competitive Landscape, Analyst Overview of Investment Opportunities |
| Countries Covered | California, Washington, Oregon, New York, United States |
| Market Leaders Profiled | Exxon Mobil Corporation, ConocoPhillips Company, Chevron Corporation, Shell PLC, Expand Energy Corporation, Equinor ASA, PetroChina Company Limited, EQT Corporation, Occidental Petroleum Corporation, BP Plc, Coterra Energy Inc., and Kolibri Global Energy Inc. |
SEGMENTAL ANALYSIS
By Application Insights
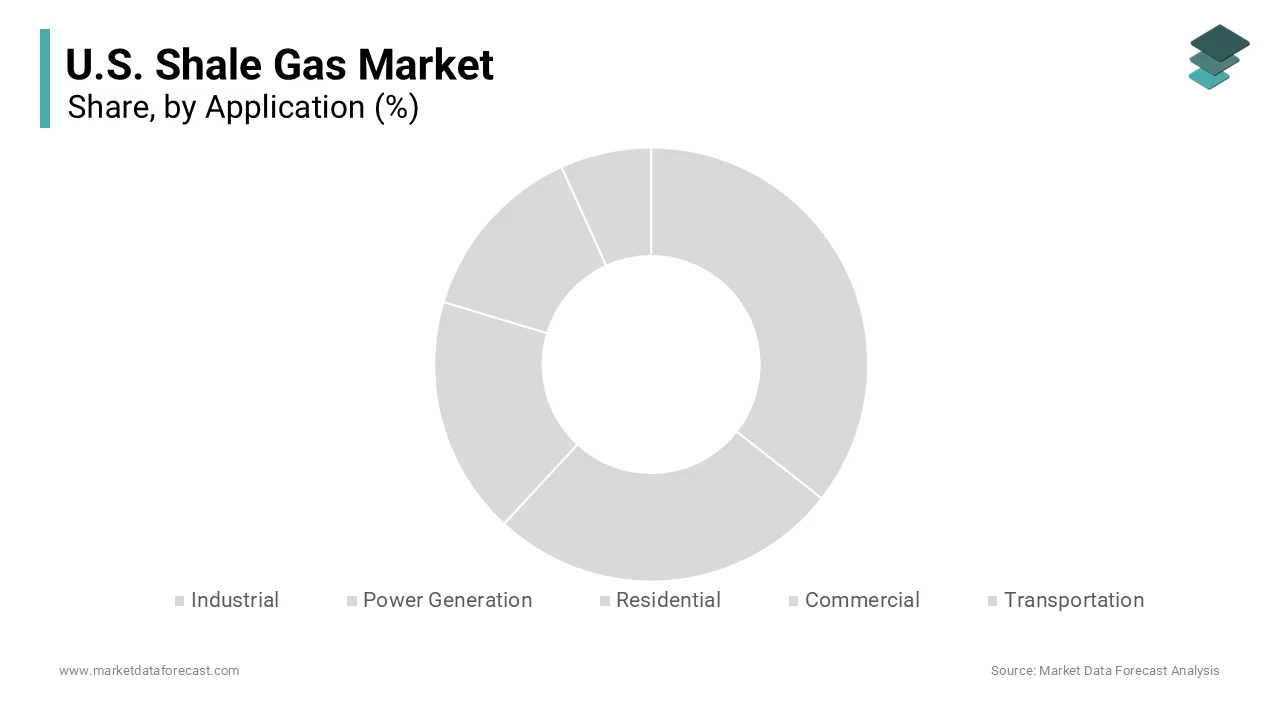
The automotive application segment held the majority share of 63.6% of the United States battery market in 2025. This supremacy was driven by the structural transition of the light duty and commercial vehicle fleet from internal combustion to electric drivetrains, supported by federal mandates, consumer incentives, and corporate fleet decarbonization targets. The Bureau of Transportation Statistics and industry reports indicate that U.S. battery electric vehicle sales surpassed 1.1 million units in 2023, representing an expansion of nearly 50% over the previous year. Each vehicle requires between sixty and one hundred twenty kilowatt hours of battery capacity, translating to annual demand exceeding one hundred and ten gigawatt hours solely from passenger cars. Supported by multibillion-dollar federal loan commitments from the Department of Energy and advanced manufacturing tax credits under the Inflation Reduction Act, major automakers have established a sweeping network of dedicated battery manufacturing facilities across the United States. Corporate sustainability disclosures show that major commercial fleets are accelerating electrification by ordering tens of thousands of electric delivery vehicles equipped with specialized battery packs optimized for regional logistics. The Environmental Protection Agency's revised tailpipe emissions standards set stringent fleet-wide pollution limits through 2032, incentivising automakers to significantly expand their electric and hybrid vehicle sales mix over the decade. Battery innovations tailored for automotive use, such as cell to pack designs and silicon anodes, further entrench this segment’s leadership by improving range, charging speed, and cost per mile.
However, the aerospace and defense battery segment is on the rise and is expected to be the fastest growing segment in the market by witnessing a CAGR of 43.1% between 2026 and 2034 owing to electrification of military platforms, unmanned systems, and next generation aviation technologies. The Department of Defense invests heavily in advanced battery research and procurement, prioritizing specialized energy storage technologies to improve soldier-worn systems, drone operations, and tactical silent-watch capabilities. The Defense Logistics Agency coordinates the high-volume procurement of ruggedized lithium-based batteries to power portable communication networks, night vision devices, and field equipment deployed globally. The U.S. Air Force’s Agility Prime program has partnered with startups including Beta Technologies and Joby Aviation to certify electric vertical takeoff and landing aircraft for logistics and medical evacuation, each requiring between one hundred and four hundred kilowatt hours of battery capacity per airframe. NASA's Artemis program requires advanced energy storage systems engineered to withstand vacuum environments and radical temperature fluctuations during lunar exploration missions. Commuter aerospace firms are developing fully electric aircraft prototypes like the Eviation Alice, which utilizes high-capacity battery systems to pioneer zero-emission short-haul regional flight. This convergence of defense modernization, space exploration, and commercial aviation innovation is transforming aerospace and defense into the most dynamically growing battery application segment.
COUNTRY LEVEL ANALYSIS
The United States led the global shale gas market and occupied a 80.5% share in 2025. This leading position of the US market was supported by technological leadership in horizontal drilling and hydraulic fracturing, a permissive private mineral rights regime, and a dense network of pipelines and processing infrastructure concentrated in the Marcellus, Permian, and Haynesville basins. The U.S. Energy Information Administration confirms that shale gas production averaged nearly 80 billion cubic feet per day in 2023, combining with conventional production to fully satisfy domestic demand and support nearly 12 billion cubic feet per day in LNG exports. The Federal Energy Regulatory Commission has approved over 20 billion cubic feet per day of operational and under-construction LNG export capacity, anchoring the United States' role as a vital supplier to global markets during geopolitical energy disruptions. The Inflation Reduction Act's methane fee and enhanced 45Q carbon capture credits are driving robust investment in emissions reduction technologies, positioning U.S. producers to align with tightening European Union and Japanese low-carbon import requirements. The Department of Energy's Loan Programs Office offers conditional loans and loan guarantees to scale carbon management projects, supporting technological deployments aimed at reducing the carbon footprint of domestic fossil fuel infrastructure.
COMPETITIVE LANDSCAPE
The United States shale gas market is characterized by intense competition among integrated supermajors, large independents, and private equity backed operators, all vying for premium acreage, skilled labor, and export market access. Competition is no longer defined by production volume alone but by capital efficiency, emissions intensity, and integration with downstream markets such as LNG and hydrogen. Supermajors like ExxonMobil and Chevron leverage scale and balance sheet strength to acquire strategic assets and invest in decarbonization infrastructure, while independents such as EOG and Pioneer focus on technological differentiation and operational agility to outperform in core plays. Private operators, unconstrained by public shareholder demands, often pursue aggressive growth in emerging basins, pressuring service costs and land values. The Federal Energy Regulatory Commission’s approval of new LNG terminals has intensified competition for gas supply, with producers signing tolling agreements or equity stakes in export facilities to secure market access. Regulatory compliance, particularly around methane monitoring and water use, has become a critical differentiator as state and federal rules tighten. Technological innovation in drilling, completions, and emissions control remains the primary battleground, with companies investing heavily in proprietary data analytics, electrification, and carbon capture to reduce costs and enhance sustainability credentials. The convergence of energy transition pressures and global geopolitics ensures that competitive advantage increasingly favors those who can deliver molecules with verifiable low carbon intensity and logistical reliability.
KEY MARKET PLAYERS
Some of the companies that are playing a dominating role in the U.S. shale gas market are
- Exxon Mobil Corporation
- ConocoPhillips Company
- Chevron Corporation
- Shell PLC
- Expand Energy Corporation
- Equinor ASA
- PetroChina Company Limited
- EQT Corporation
- Occidental Petroleum Corporation
- BP Plc
- Coterra Energy Inc.
- Kolibri Global Energy Inc.
Top Players in the Market
- ExxonMobil remains a cornerstone of U.S. shale gas production through its dominant position in the Permian Basin and strategic acquisitions in the Appalachian region. The company leverages proprietary drilling analytics and multi well pad development to maximize recovery while minimizing surface footprint. It also signed long term LNG supply agreements with European and Asian buyers, linking domestic production to global decarbonization demand. ExxonMobil’s proprietary methane monitoring satellite network, launched in partnership with GHGSat, enhances emissions accountability and regulatory compliance across its asset base.
- Chevron maintains leadership in U.S. shale gas through its extensive operations in the Permian Basin and growing presence in the Haynesville Shale. The company prioritizes capital discipline and operational efficiency, utilizing real time reservoir modeling to optimize well spacing and completion design. It also launched a blue hydrogen pilot in Louisiana, co locating production with existing gas processing facilities. Chevron’s partnership with Microsoft to deploy AI driven drilling optimization tools has reduced well completion costs by fifteen percent while increasing initial production rates.
- EOG Resources operates as one of the most technologically advanced and capital efficient independent shale gas producers in the United States, with core positions in the Eagle Ford, Permian, and Utica shales. The company pioneered the use of downhole fiber optic sensing and machine learning to predict fracture propagation and reservoir response. It also expanded its water recycling network to treat and reuse over ninety percent of produced water. EOG’s proprietary GeoSphere reservoir mapping technology enables precise targeting of high pressure, high porosity zones, increasing estimated ultimate recovery per well by up to twenty five percent.
Top Strategies Used by the Key Market Participants
Leading participants in the United States shale gas market prioritize capital discipline by tying drilling budgets to free cash flow generation rather than production growth targets. They deploy advanced analytics and artificial intelligence to optimize well placement, completion design, and equipment maintenance, reducing costs and improving recovery rates. Companies invest in midstream infrastructure including pipelines, processing plants, and fractionation facilities to control logistics and capture margin across the value chain. Strategic acquisitions of smaller operators or adjacent acreage consolidate core positions and eliminate competition for services. Firms increasingly integrate carbon capture and methane monitoring technologies to comply with federal regulations and access premium export markets. Partnerships with LNG exporters and industrial consumers lock in long term offtake agreements that provide revenue certainty. Electrification of field operations using renewable power or grid supply reduces emissions and operating expenses. Companies lobby for streamlined permitting and unified federal standards to accelerate infrastructure development. Water recycling and reuse programs mitigate environmental opposition and regulatory risk. Finally, they align executive compensation with emissions reduction and return on capital metrics to satisfy institutional investor mandates.
MARKET SEGMENTATION
This research report on the U.S. shale gas market is segmented and sub-segmented into the following categories.
By Application
- Industrial
- Power Generation
- Residential
- Commercial
- Transportation
By Country
- California
- Washington
- Oregon
- New York
- Rest of the United States