Asia Pacific Clean Label Ingredients Market Research Report – Segmented By Form (Dry, Liquid), By Type (Natural Colors, Starch & Sweeteners, Natural Flavors, Fruit & Vegetable Ingredients, Flours, Others), Application (Beverages, Bakery, Dairy, Frozen Products, Processed Foods, Others), And Country (India, China, Japan, South Korea, Australia, New Zealand, Thailand, Malaysia, Vietnam, Philippines, Indonesia, Singapore And Rest Of APAC) - Industry Analysis On Size, Share, Trends & Growth Forecast (2026 To 2034)
Asia Pacific Clean Label Ingredients Market Size
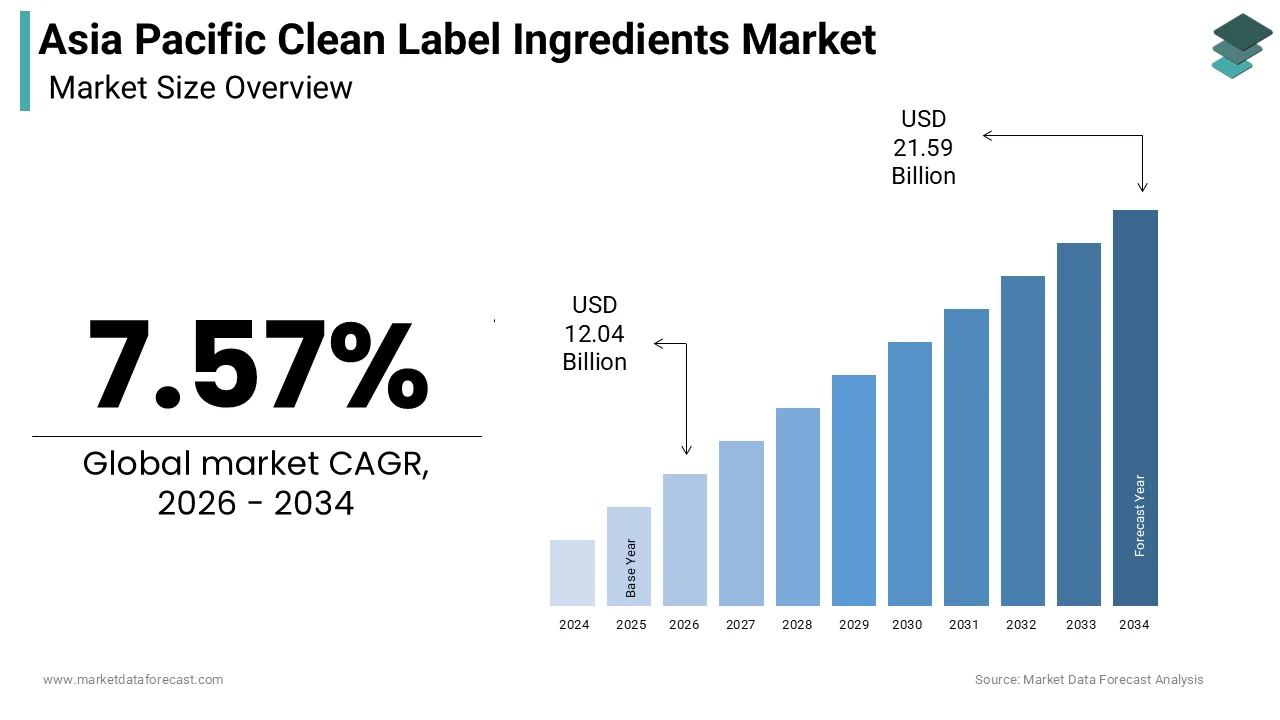
The size of the Asia Pacific Clean label ingredients market was calculated to be USD 11.19 billion in 2025 and is anticipated to be worth USD 21.59 billion by 2034, from USD 12.04 billion in 2026, growing at a CAGR of 7.57% during the forecast period.
The Clean Label Ingredients market is showcasing significant potential in the mentioned forecast period. The market continues to build up momentum with the developments witnessed by the food ingredients sector, which provide a variety of benefits. Clean-label ingredients are a class of food additives and ingredients that include products like sweeteners, colors, flavors, etc. These ingredients have properties that categorize them under the clean label, which are primary as well as secondary. Primary factors are fewer product ingredients without any chemical name and no artificial additives. Secondary factors include natural, organic, and non-GMOs.
The rise of awareness among people regarding health issues related to the use of artificial food additives and food safety incidents has led to a sudden growth in the market for clean-label ingredients. Further, an increase in consumer demand for clean-label food products has been driving the consumption of clean-label ingredients and the need for clean-label product launches. The company faces a few challenges and restraints as well. These include clean label ingredients’ limitations compared to the artificial ones, high cost of ingredients resulting in costly products and hence low consumption.
This research report on the Asia Pacific clean label ingredients market is segmented and sub-segmented into the following categories.
Asia Pacific Clean Label Ingredients Market By Application
- Bakery
- Dairy
- Beverages
- Processed Foods
- Frozen Products
- Others
Asia Pacific Clean Label Ingredients Market By Form
- Liquid
- Dry
Asia Pacific Clean Label Ingredients Market By Type
- Natural Colors
- Natural Flavors
- Flours
- Fruit & Vegetable Ingredients
- Starch & Sweeteners
Asia Pacific Clean Label Ingredients Market By Region
- India
- Japan
- China
- Australia
- Singapore
- Malaysia
- South Korea
- New Zealand
- Southeast Asia
KEY MARKET PLAYERS
Major key Players in the APAC Clean Label Ingredients Market are Cargill, Archer Daniels Midland Company, Koninklijke DSM N.V., E.I. Dupont De Numours and Company, Kerry Group Plc, Ingredion Incorporated, Tate & Lyle PLC, Sensient Technologies Corporation, Corbion N.V., and Groupe Limagrain
Frequently Asked Questions
1. What are the key drivers of market growth?
Growth is driven by rising health awareness, increasing demand for natural and organic foods, urbanization, and higher disposable incomes across countries like China and India.
2. Why are consumers shifting toward clean label ingredients?
Consumers prefer transparency, simple ingredient lists, and safer food options due to concerns about artificial additives and food safety.
3. Which industries primarily use clean label ingredients?
The food and beverage industry dominates, including bakery, dairy, beverages, processed foods, and frozen products.
4. What are the major types of clean label ingredients?
Key types include natural colors, flavors, sweeteners, preservatives, starches, and plant-based additives.
5. What are the key trends in the market?
Major trends include plant-based ingredients, organic product demand, clean-label beverages, and adoption of fermentation-based technologies.
6. What challenges does the market face?
Challenges include high production costs, supply chain complexity, regulatory differences across countries, and limited shelf life of natural ingredients.
7. How do regulations impact the market?
Strict labeling laws and food safety regulations promote transparency but can increase compliance costs and complexity for manufacturers.
8. What role does the beverage industry play in this market?
The beverage segment is a major contributor due to rising demand for natural, low-sugar, and additive-free drinks.
9. What opportunities exist in the market?
Opportunities lie in product innovation, expansion of plant-based ingredients, clean-label convenience foods, and growing online food retail channels.
10. What is the future outlook of the market?
The market is expected to witness steady growth driven by increasing consumer awareness, technological advancements, and expanding food processing industries across the Asia Pacific.
Related Reports
Access the study in MULTIPLE FORMATS
Purchase options starting from
$ 2000
Didn’t find what you’re looking for?
TALK TO OUR ANALYST TEAM
Need something within your budget?
NO WORRIES! WE GOT YOU COVERED!
Call us on: +1 888 702 9696 (U.S Toll Free)
Write to us: sales@marketdataforecast.com