Global Clean Label Ingredients Market Size, Share, Trends, & Growth Forecast Report – Segmented By Form (Dry, Liquid), Type (Natural Colors, Starch & Sweeteners, Natural Flavors, Fruit & Vegetable Ingredients, Flours, Others), Application (Beverages, Bakery, Dairy, Frozen Products, Processed Foods, Others), And Region (North America, Europe, Asia Pacific, Latin America, And Middle East & Africa) - Industry Analysis (2025 To 2033)
Global Clean Label Ingredients Market Size
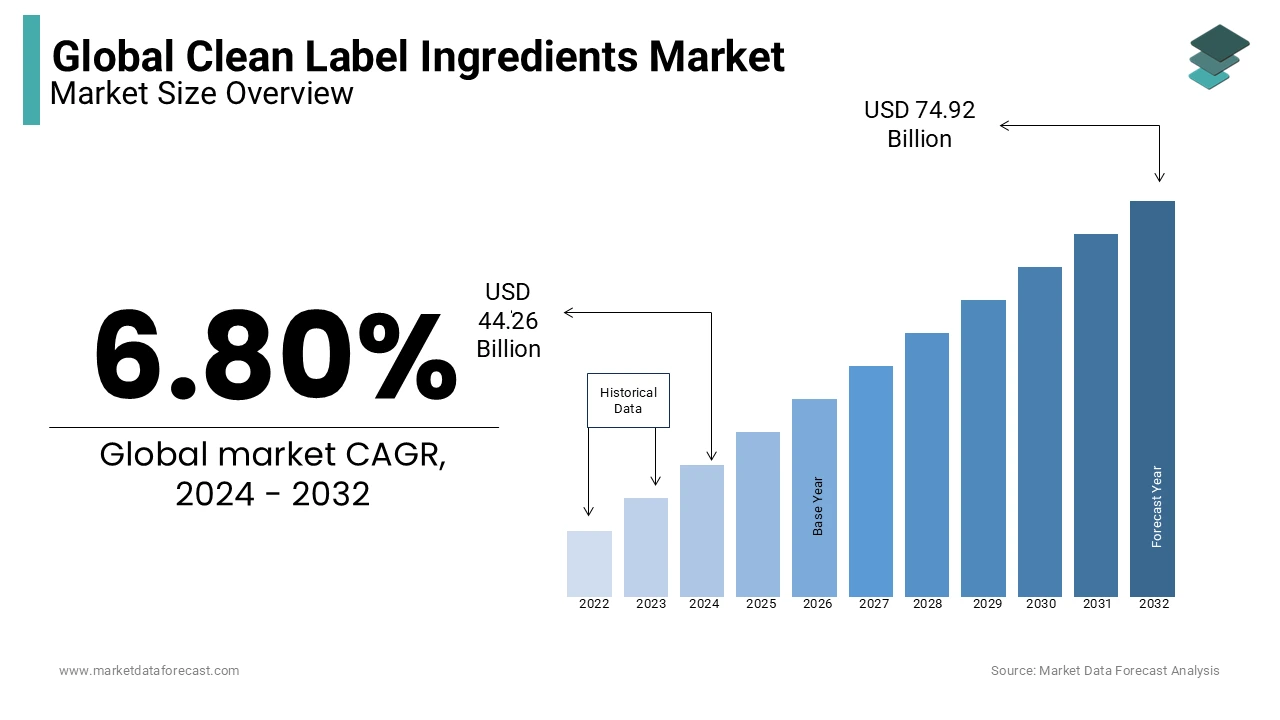
The global clean label ingredients market size was calculated as USD 44.26 billion in 2024, and is anticipated to be worth USD 80.01 billion by 2033 from USD 47.27 billion In 2025, growing at a CAGR of 6.80% during the forecast period. The increase in clean-label products is due to the mounting consumer preference for clean-label foods that indirectly induce the consumption of such ingredients.
The ingredients in the "clean label" are food additives and other ingredients and secondary factors that comply with one or both colors, flavorings, fruit and vegetable ingredients, starch and sweeteners, wheat flour, salt and other key elements. The main factors are not chemicals, few easy-to-understand product ingredients, or additives or artificial ingredients. The health problems associated with consuming artificial food additives, where people become health warnings and pay attention to food safety, are increasing the growth of the market.
MARKET DRIVERS
Consumers' preference for organic food continues to increase due to increased consumer health awareness.
Also, benefits such as the growth of supplemental foods from unprocessed foods, natural foods, and organic foods have led to increased disposable income, better living standards, higher health costs, and large-scale promotion of organic foods. Increasing disposable income requires a high standard of living. Besides, the demand for quality food and nutrition is increasing due to urbanization and a growing workforce. Products like instant noodles, frozen meals, packaged products, energy drinks, and baked goods are an integral part of everyday life. The increase in food and beverages is also expected to increase demand for food ingredients. These foods include several ingredients and preservatives to extend the shelf life of the product, maintain its quality, and reduce spoilage by various microorganisms. Consumers demand the addition of clean labeling ingredients to these everyday products. It has become a driving force in the market for clean-label materials. The demand for clean labels is clear, but consumers still want meat that is naturally juicy and flavorful, but the product must provide a long and safe shelf life. Clean labels have influenced the flavors market worldwide, and color and flavor producers have responded to R&D innovation and investment. A popular trend in healthy living has increased consumer awareness of considering components used in food. Consumers these days prefer natural, healthy, and simple foods without chemical substances. Consumers are often very cautious when choosing clean-label products in relation to products consumed by children.
Other major product categories in the clean-label ingredient market include nutritional bars/beverages, dairy products, cereals, yogurt, and cereals. Clean-label caramel ingredients, pickled vegetables, cheese concentrates, dairy concentrates, vegetable purees, essential oils, spices, gums, industrial garlic, tomato powder, and salt moderators are a few significant organic foods. Income levels and age groups play an important role in the decision to buy clean-level products. Millennials are clearly driving this change. However, as the number of baby boomers increases, they also participate in this movement. Consumers' preference for organic food continues to increase due to increased consumer health awareness. Furthermore, the benefits of flammables and nature, the rapid increase in disposable income, the improvement of living standards, the increase in health spending, and the large-scale promotion of organic foods are driving the growth of organic foods. With the use of artificial elements, additives, or dyes like E133 and the inclusion of controversial food technologies like GMOs, consumers have become concerned about the health side effects that accompany this food system. With the general trend, the clean label and driving force are increasing. Consumers have a growing interest in materials and their origins influence the purchase of new products. This trend is presumed to create profitable opportunities in the market for clean-label materials.
MARKET RESTRAINTS
The high expenses related to clean ingredients are a limiting aspect of the expansion of the market.
The ability to balance ingredient mixes to suit consumer choice is a big challenge for ingredient mixers. Due to the development of various products, issues such as shelf life and processing requirements have increased. Consumers demand shorter, cleaner labels as well as simpler ingredients, but they don't compromise on quality or taste. This balance is a great challenge for both ingredient mixers and product manufacturers.
REPORT COVERAGE
|
REPORT METRIC |
DETAILS |
|
Market Size Available |
2024 to 2033 |
|
Base Year |
2024 |
|
Forecast Period |
2025 to 2033 |
|
CAGR |
6.80% |
|
Segments Covered |
By Form, Type, Application, And Region |
|
Various Analyses Covered |
Global, Regional and Country Level Analysis; Segment-Level Analysis; DROC; PESTLE Analysis; Porter’s Five Forces Analysis; Competitive Landscape; Analyst Overview of Investment Opportunities |
|
Regions Covered |
North America, Europe, APAC, Latin America, Middle East & Africa |
|
Market Leaders Profiled |
Cargill, Archer Daniels Midland Company, Koninklijke DSM N.V., E.I. Dupont De Numours and Company, Kerry Group Plc, Ingredion Incorporated, Tate & Lyle PLC, Sensient Technologies Corporation, Corbion N.V., and Groupe Limagrain |
SEGMENTAL ANALYSIS
Global Clean Label Ingredients Market Analysis By Form
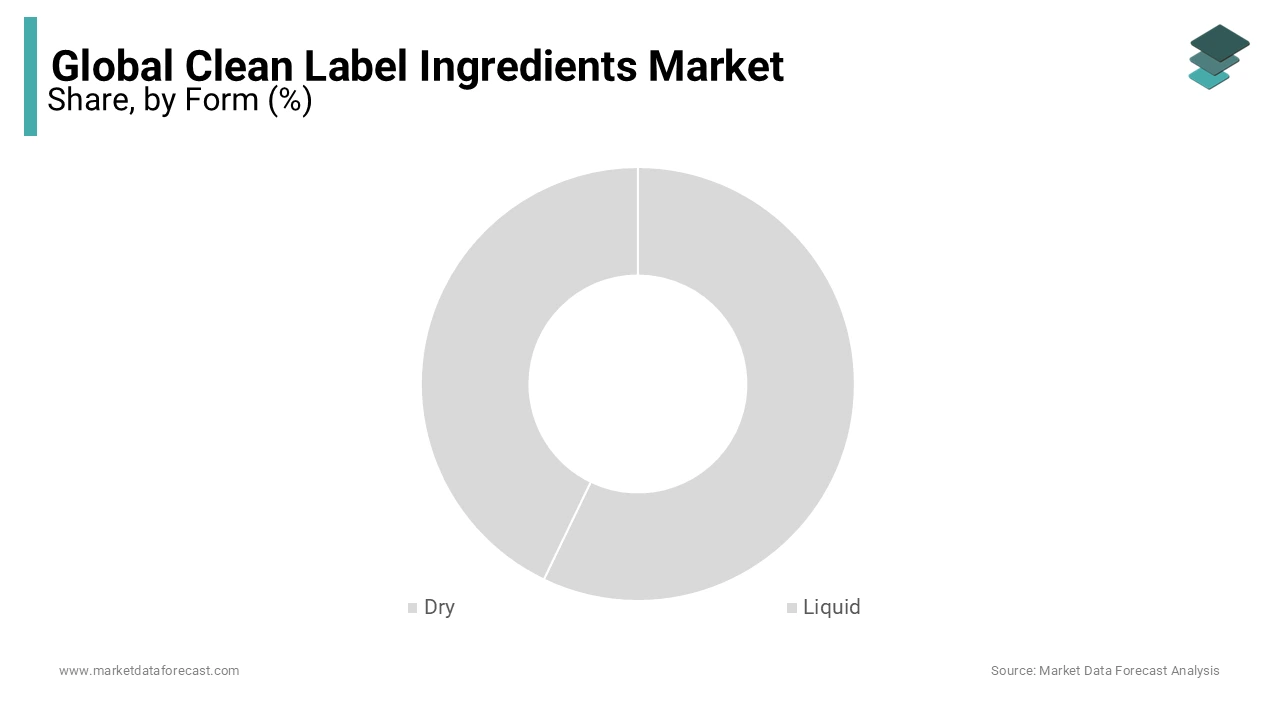
The dry form segment is leading with a significant share of the clean-label ingredients market. In general, these forms are most genuine and free from any artificial compounds, which are substantially hindering the growth rate of the market. The growing number of people concentrating on eating high-quality food to maintain well-being by strictly avoiding harmful additives added to various food products is associated with gearing up the need for clean label ingredients. The growing concentration on avoiding high-risk chronic diseases like diabetes, cancer, and others by only eating clean food is additionally bolstering the growth rate of the market. According to IDF Diabetes Atlas research, diabetes is becoming one of the major challenges for humans to live healthily. The study revealed that there will be 243 million people, especially adults, suffering from diabetes by 2030. At present, 1 in 10 people have diabetes, and the number is certainly going to increase in the coming days due to unhealthy diets. Therefore, the rising awareness of eating prominent foods is ascribed to bolstering the growth rate of the market.
The liquid form is likely to have steady growth opportunities in the coming years. Increasing use of this form of clean-label ingredients in various food and beverages is majorly driving the growth rate of this segment.
Global Clean Label Ingredients Market Analysis By Type
The natural colors segment is ruling with a significant share of the clean-label ingredients market. The importance of making high-quality products using organic ingredients like natural colors is likely to elevate the growth rate of the market. The starch and sweeteners segment is positioned second in leading the market share owing to the added texture and taste according to the recipe. F&B industries are making various changes in adding innovative flavors and textures according to the customer’s preferences in recent years, which is solely amplifying the market’s growth rate to the extent.
The fruits and vegetable ingredients segment is accounted to have the fastest growth rate during the forecast period. These ingredients have prominent nutritional value that naturally occur, are gaining high popularity, especially in urban cities, and are gearing up for the growth rate of the market.
Global Clean Label Ingredients Market Analysis By Application
The bakery segment is holding the dominant share of the market. The launch of clean-label ingredients to attract customers where there are no sounds of artificial flavors or ingredients is substantially prompting the growth rate of the market. In today’s world, people are choosing naturally prepared bakery goods and items with minimally processed processes, which is eventually fueling the growth rate of this segment.
The dairy segment is likely to have the highest CAGR by the end of 2029. These products are highly used in regular diets to maintain a well-balanced health and avoid the risk of various health diseases
REGIONAL ANALYSIS
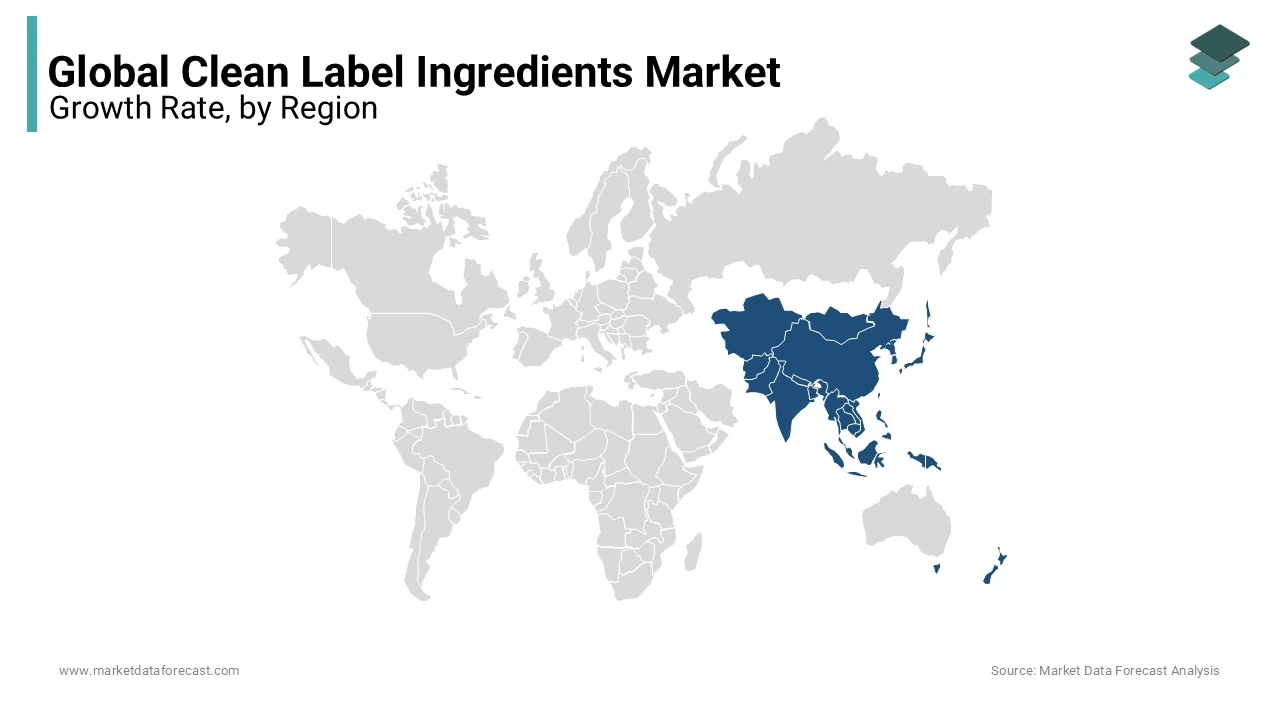
The global clean label ingredient market has been classified into seven major regions, including North America, Latin America, Eastern Europe, Western Europe, Japan, the Middle East and Africa, and Asia Pacific. The clean label ingredient market is expected to record healthy CAGRs over the outlook period worldwide. Countries such as the UK, Spain, Germany, Italy, and Hungary have multiple clean-label ingredient products, making it the largest consumer of clean-label ingredients. This has made Eastern and Western Europe a dominant area in the global clean-label ingredient market. With growing awareness of healthy foods, Asia Pacific has chosen cleaner labeling ingredients than artificial ones. The clean label market in the Asia Pacific region has a compound annual rate of 7.4%. The Asia Pacific has people with diverse economic backgrounds. The main reason for the fast-moving market in Asia is the rising standard of living for consumers. Consumers in their area take the time to review the ingredients list of their products before buying. The growing demand for clean-label convenience products is also a factor in strengthening the market. China is the most exceptional locale in the clean-label ingredients business in the Asia Pacific. Market giants are targeting the Asia Pacific vicinity to increase the benefits of clean-label ingredients as consumer interest in healthy eating habits increases and their knowledge of ingredients used in food increases. The market for clean-label materials is expected to enter Africa soon. There is a growing awareness of clean-label ingredients in many countries, and manufacturers are forced to use more natural clean-label ingredients than artificial and synthetic ingredients.
KEY PLAYERS IN THE GLOBAL CLEAN-LABEL INGREDIENTS MARKET
Major Key Players in the global clean label ingredients market are Cargill, Archer Daniels Midland Company, Koninklijke DSM N.V., E.I. Dupont De Numours and Company, Kerry Group Plc, Ingredion Incorporated, Tate & Lyle PLC, Sensient Technologies Corporation, Corbion N.V., and Groupe Limagrain
RECENT HAPPENINGS IN THE MARKET
- Nestlé USA aims to remove all artificial colors from chocolate candy products and artificial flavors from all frozen snacks and pizzas.
- Red Bull has introduced a wide range of organic soda products, which are available in only two regions of the United States, which is another example of how the company embraces the clean label concept.
- Cargill has obtained approval from the Ministry of Health and Welfare for the use of sunflower lecithin products, expanding Japan's clean label portfolio.
DETAILED SEGMENTATION OF GLOBAL CLEAN-LABEL INGREDIENTS MARKET INCLUDED IN THIS REPORT
This research report on the global clean-label ingredients market has been segmented and sub-segmented based on form, type, application, & region.
By Form
- Dry
- Liquid
By Type
- Natural Colors
- Starch & Sweeteners
- Natural Flavors
- Fruit & Vegetable Ingredients
- Flours
- Others
By Application
- Beverages
- Bakery
- Dairy
- Frozen Products
- Processed Foods
By Region
- North America
- Europe
- Asia Pacific
- Latin America
- Middle East and Africa
Frequently Asked Questions
1. What is driving the growth of the clean label ingredients market?
The growing consumer demand for natural and organic products, increasing awareness about health and wellness, concerns about food safety, and regulatory pressures to label ingredients accurately are critical drivers of the clean-label ingredients market's growth.
2. Are there any challenges associated with clean label ingredients?
There are challenges, such as sourcing high-quality natural ingredients at scale, maintaining product stability and shelf life without synthetic additives, dealing with higher production costs, and ensuring consistent flavor and texture in clean-label formulations.
3. What are the global trends in the clean label ingredients market?
Global trends include the rise of plant-based and organic food products, increased demand for non-GMO and gluten-free options, innovations in natural food colors and flavors, and the integration of sustainability practices throughout the supply chain.
Related Reports
Access the study in MULTIPLE FORMATS
Purchase options starting from $ 2500
Didn’t find what you’re looking for?
TALK TO OUR ANALYST TEAM
Need something within your budget?
NO WORRIES! WE GOT YOU COVERED!
Call us on: +1 888 702 9696 (U.S Toll Free)
Write to us: [email protected]