North America Protein Labelling Market Research Report – Segmented By Product (Enzymes, Kits and Services), Labelling Method, Application, End-User & Country (the United States, Canada & Rest of North America) - Industry Analysis From 2026 to 2034
North America Protein Labelling Market Report Summary
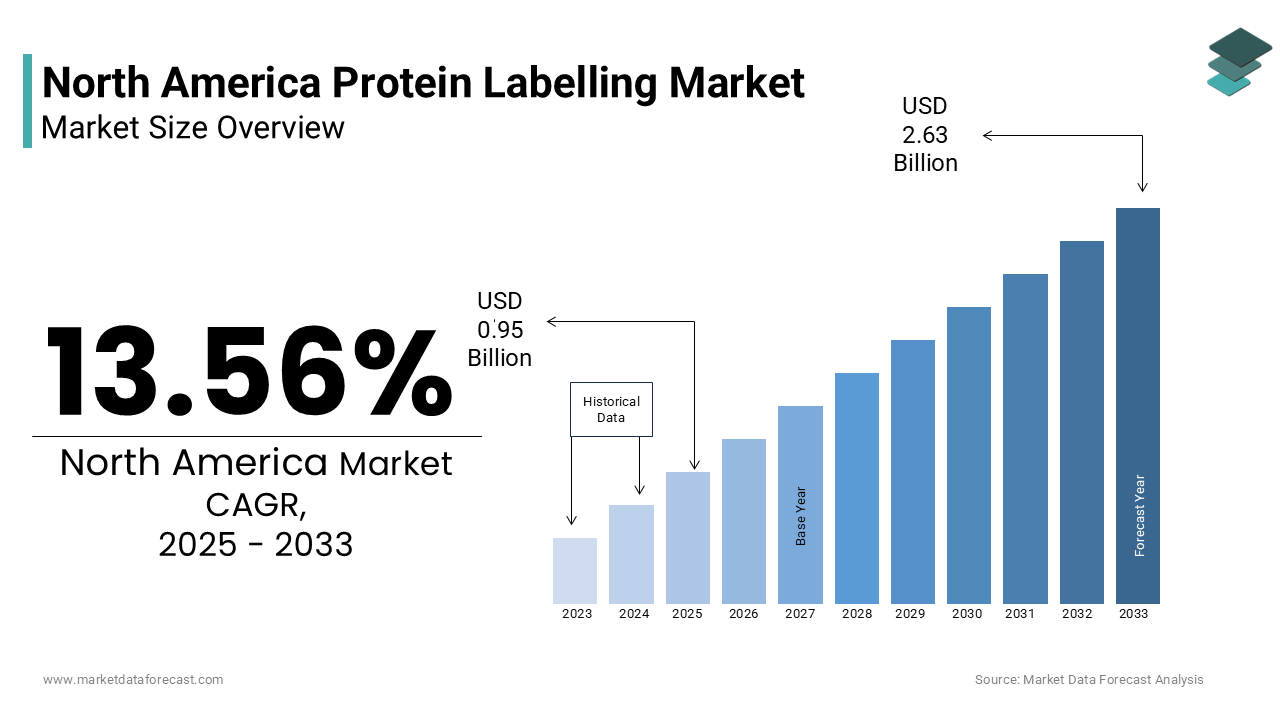
The North America protein labelling market was valued at USD 0.95 billion in 2025 and is projected to reach USD 2.99 billion by 2034, growing at a CAGR of 13.56% during the forecast period from 2026 to 2034. North America remains the most lucrative region, accounting for over 38% of global revenue in 2025. The growth of the market is primarily driven by the rapid expansion of proteomics research, increasing adoption of protein labelling techniques in drug discovery and diagnostics, and strong integration with genomic sequencing and personalized medicine initiatives. Rising healthcare expenditure, robust R&D investments, and continuous technological advancements in bioengineering and labelling chemistries are further accelerating market growth across the region.
Key Market Trends
- Increasing use of protein labelling in proteomics, genomics, and personalized medicine research workflows.
- Continuous launch of advanced dyes, reagents, and kits designed for higher precision and simplified labelling processes.
- Growing adoption of bioengineering and molecular biology technologies in academic and industrial research settings.
- Rising oncology research activity, boosting demand for protein detection and imaging techniques.
- Strong focus by market players on reducing procedural complexity and improving labelling accuracy.
Segmental Insights
- Based on product, the kits and services segment held a significant share of the North America protein labelling market in 2024, owing to their ease of use, standardized protocols, and widespread adoption in research laboratories and pharmaceutical companies.
- Based on labelling method, the in vitro labelling segment dominated the market in 2024 due to its extensive use in controlled experimental environments, high reproducibility, and compatibility with multiple analytical techniques.
- Based on application, the cell-based assay segment accounted for a prominent share of the market, driven by its critical role in drug discovery, toxicity testing, and functional protein analysis in biomedical research.
Regional Insights
North America continues to dominate the global protein labelling market, supported by advanced healthcare infrastructure, strong funding for life sciences research, and the presence of leading biotechnology and pharmaceutical companies.
- The United States represents the largest contributor to the regional market, driven by high investments in proteomics, cancer research, and personalized medicine, along with favorable policies supporting innovation and clinical research.
- Canada follows with steady growth, supported by government-backed research initiatives, expanding academic research programs, and increasing collaboration with global life science companies.
Competitive Landscape
The North America protein labelling market is characterized by the strong presence of established global players with extensive product portfolios, advanced technological capabilities, and wide distribution networks. Companies are focusing on innovation, frequent product launches, and strategic collaborations to strengthen their market position. Emphasis on developing highly specific, cost-effective, and user-friendly labelling solutions is shaping competitive strategies. Prominent players in the North America protein labelling market include Thermo Fisher Scientific, Inc., General Electric Company, Merck KGaA, Eurogentec S.A., PerkinElmer, Inc., F. Hoffmann-La Roche AG, New England Biolabs, Kaneka Corporation, Kirkegaard & Perry Laboratories, Promega Corporation, LI-COR, Inc., and SeraCare Life Sciences, Inc.
North America Protein Labelling Market Size
The North America protein labelling market size was valued at USD 0.95 billion in 2025 and is anticipated to reach USD 1.08 billion in 2026 from USD 2.99 billion by 2034, growing at a CAGR of 13.56% during the forecast period from 2026 to 2034.
The most prominent players in the region are working on enhancing their portfolios on offer. The rise in the adoption of protein labeling in tandem with the development of genomic sequencing and personalized medicine is the major factor accounting for the region’s dominant position.
The North American market is witnessing several new product launches and improvements in existing technologies to accelerate demand growth. Growing adoption of bioengineering technologies, increasing health care awareness, and growing investments in R&D. Moreover, growing proteomics research is boosting the market growth.
Rising healthcare spending, coupled with increasing expenditure on research and development, is driving the market growth. The companies are focused on reducing the complexity of the protein labeling process by improving existing technologies. The industry sees an increase in new product launches and an increasing adoption of bioengineering technologies to accelerate market growth. The evolution of the technology to produce advanced dyes that are quickly conjugated to particular peptides or nucleotides to detect their presence and the other purification process with greater precision is estimated to make the process more organized and positively impact the market. For example, the American Cancer Society, Inc. has estimated that approximately 1,865,420 new cancer cases and 709,830 cancer deaths will be diagnosed in the United States in 2020. However, reagents and kits used for antibody labelling or functional groups of proteins are expensive. Thus, its use is limited in some areas due to this barrier, and alternatives are used to diagnose chronic diseases, such as cancer. These procedures are performed only by qualified professionals.
However, irregularity in the procedure for protein labelling and strict government regulations are significant challenges in the North American protein labelling market. In addition, due to the lack of skilled professionals, the protein labelling market's growth is limited, which is a significant obstacle.
REPORT COVERAGE
| REPORT METRIC | DETAILS |
| Market Size Available | 2025 to 2034 |
| Base Year | 2025 |
| Forecast Period | 2026 to 2034 |
| CAGR | 13.56% |
| Segments Covered | By Product, Labelling Method, Application, End-User and Region. |
| Various Analyses Covered | Global, Regional & Country Level Analysis, Segment-Level Analysis, DROC, PESTLE Analysis, Porter’s Five Forces Analysis, Competitive Landscape, Analyst Overview of Investment Opportunities |
| Regions Covered | U.S, Canada, Rest of North America |
| Market Leaders Profiled | Thermo Fisher Scientific, Inc., General Electric Company, Merck KGaA, Eurogentec S.A., PerkinElmer, Inc., F. Hoffmann-La Roche AG, New England Biolabs, Kaneka Corporation, Kirkegaard & Perry Laboratories, Promega Corporation, LI-COR, Inc. and SeraCare Life Sciences, Inc |
REGIONAL ANALYSIS
Geographically, North America is estimated to dominate the global protein labelling market, with a share of 38% in revenue in 2025. The presence of key players and the increase in genomics and proteomics research spending related to innovations in bioengineering technologies are the main drivers of the market in this region. In addition, the increasing adoption of personalized medicine and genomic sequencing is expected to contribute to its revenue growth during the forecast period. The North American countries of the United States (USA) and Canada have developed and well-structured healthcare systems. These systems also encourage research and development. Labelling of proteins as an area of research is also growing in this region due to its increasing variety of applications. These countries also have policies that promote this research. These policies uplift global players to launch into the United States and Canada. Therefore, these countries benefit from the presence of many players in the worldwide market. Besides, the increasing adoption of personalized medicine and genome sequencing is expected to contribute to the region's revenue growth during the forecast period.
KEY MARKET PLAYERS
A few of the leading companies in the North American protein labelling market include
- Thermo Fisher Scientific, Inc.
- General Electric Company
- Merck KGaA
- Eurogentec S.A.
- PerkinElmer, Inc.
- F. Hoffmann-La Roche AG
- New England Biolabs
- Kaneka Corporation
- Kirkegaard & Perry Laboratories
- Promega Corporation
- LI-COR, Inc.
- SeraCare Life Sciences, Inc.
MARKET SEGMENTATION
This research report on the North American protein labelling market has been segmented and sub-segmented into the following categories:
By Product
- Enzymes
- Kits and Services
By Labelling
- In vitro Labelling
- In vivo Labelling
By Application
- Cell-Based Assay
- Mass Spectroscopy
- Fluorescence Microscopy
- Immunological Technique
- Protein Microarray
By Country
- The United States
- Canada
- Rest of North America
Frequently Asked Questions
What is the North America protein labeling market?
The North America protein labeling market refers to the industry focused on products and technologies used to label, tag, or detect proteins for research, diagnostics, and pharmaceutical applications in the U.S. and Canada.
What is protein labeling?
Protein labeling is a technique used to attach detectable tags such as fluorescent dyes, enzymes, biotin, or isotopes to proteins for analysis, tracking, and visualization.
What are the key drivers of the North America protein labeling market?
Major drivers include growth in proteomics research, rising pharmaceutical and biotechnology R&D spending, increasing adoption of personalized medicine, and advancements in labeling technologies.
Which labeling methods are commonly used?
Common methods include fluorescent labeling, enzyme labeling, isotope labeling, biotinylation, and radioisotope labeling.
What are the major applications of protein labeling in North America?
Protein labeling is widely used in cell-based assays, immunoassays, protein-protein interaction studies, drug discovery, and clinical diagnostics.
Which end users dominate the North America protein labeling market?
Key end users include pharmaceutical and biotechnology companies, academic and research institutes, contract research organizations (CROs), and diagnostic laboratories.
Which countries contribute most to the North America protein labeling market?
The United States holds the largest market share, followed by Canada, driven by strong research infrastructure and funding.
What challenges does the North America protein labeling market face?
Challenges include high costs of reagents, technical complexity, protein instability during labeling, and regulatory compliance issues.
What trends are shaping the North America protein labeling market?
Key trends include automation in laboratories, increased use of high-throughput screening, and growing demand for ready-to-use labeling kits.
What is the future outlook of the North America protein labeling market?
The market is expected to grow steadily due to continuous advancements in life sciences research, increasing funding, and expanding clinical applications.
Related Reports
Access the study in MULTIPLE FORMATS
Purchase options starting from
$ 2000
Didn’t find what you’re looking for?
TALK TO OUR ANALYST TEAM
Need something within your budget?
NO WORRIES! WE GOT YOU COVERED!
Call us on: +1 888 702 9696 (U.S Toll Free)
Write to us: sales@marketdataforecast.com