- Product Description Description
- Table of Contents TOC
- List of Table & Figure LOT
- Get Free Sample PDF Sample PDF
Market Size, 2025
$380 MnMarket Estimate, 2026
$401.28 MnMarket Forecast, 2034
$620.52 MnCAGR, 2026–2034
5.60%Global Optical Spectrum Analyzer Market Size, Growth, Trends & Forecast (2026–2034)
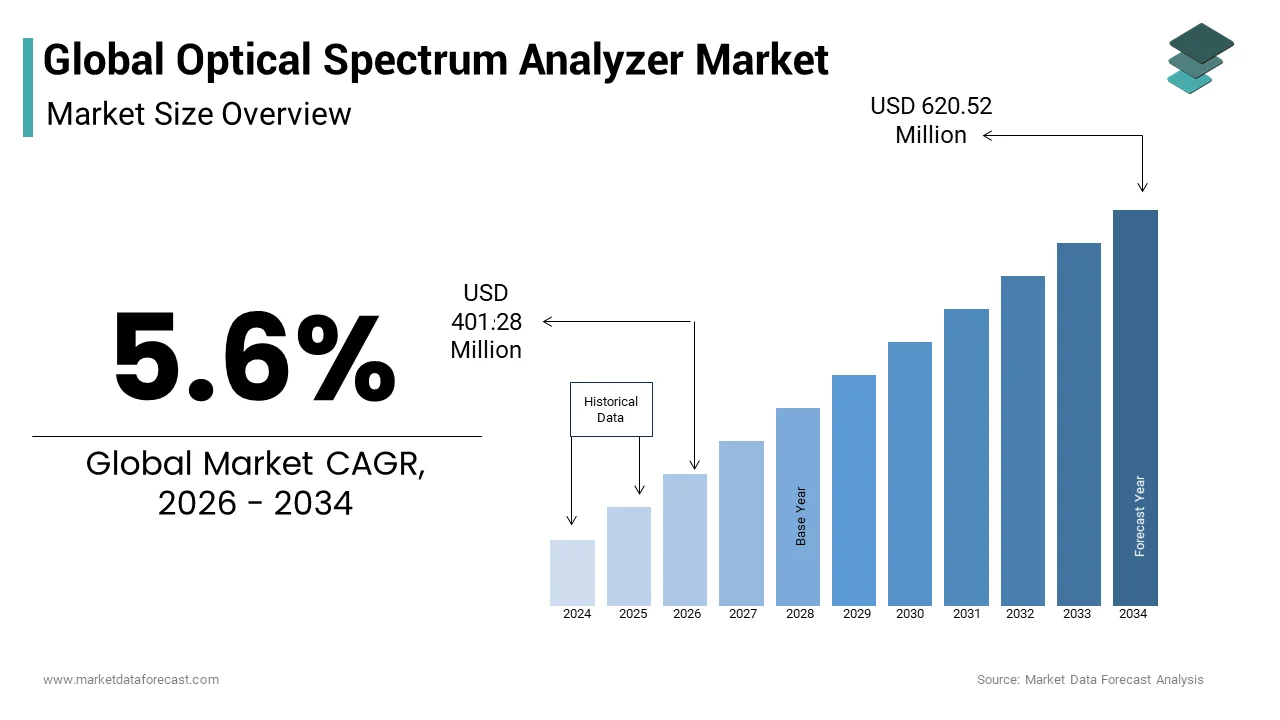
The global optical spectrum analyzer market size was valued at USD 380 million in 2025, is anticipated to reach USD 401.28 million in 2026, and is projected to scale to USD 620.52 million by 2034, expanding at a compound annual growth rate (CAGR) of 5.60% during the forecast period from 2026 to 2034. Market expansion is primarily fueled by the rapid deployment of 5G and FTTH infrastructure, advancements in coherent optical communications, and rising demand for precise photonic testing in consumer electronics.
Key Executive Metrics (At-a-Glance)
- 2025 Base Valuation: USD 380.00 Million
- 2026 Current Valuation: USD 401.28 Million
- 2034 Forecast Valuation: USD 620.52 Million
- Compound Annual Growth Rate (CAGR): 5.60% (2026–2034)
- Leading Regional Market: North America (captured a 32.7% share in 2025, driven by advanced technological infrastructure and R&D investments)
- Key Geographic Regions Covered: North America, Europe, Asia Pacific, Latin America, and Middle East & Africa
Core Market Drivers & Opportunities
- 5G & FTTH Expansion: Dense fronthaul/backhaul networks requiring rigorous spectral validation and fault detection.
- Coherent Optical Technologies: Adoption of complex modulation formats (400G/800G interfaces) demanding high-resolution analysis.
- AI Integration & Portability: Smart automated signal analysis and ruggedized handheld devices enhancing field service efficiency.
Primary Market Restraints & Challenges
- High Instrument Costs: Premium OSAs exceeding USD 50,000 alongside substantial annual calibration and maintenance expenses.
- Technical Complexity & Obsolescence: Steep operational learning curves and rapid technological turnover creating financial burdens.
Market Segmentation: Largest and Fastest-Growing Sectors
| Segment Category | Largest Segment | Fastest-Growing Segment |
|---|---|---|
| By Product Type | Benchtop OSAs (Preferred for R&D and OEM manufacturing with high resolution) | Handheld OSAs (CAGR of 8.9%, driven by field technician needs for FTTH/5G maintenance) |
| By Mode Type | Spectrometer Mode (Essential for broadband light sources and DWDM monitoring) | Wavelength Meter Mode (CAGR of 7.5%, driven by ultra-precise coherent systems) |
| By End Use | Telecommunication Operators & OEMs | Consumer Electronics & Photonics Devices (CAGR of 9.2%, fueled by LiDAR, VCSELs, and AR/VR sensors) |
| By Region | North America (32.7% share in 2025) | Asia Pacific (Propelled by massive infrastructure and base station rollouts in China and India) |
Major Industry Players Profiled
Key market participants shaping the global optical spectrum analyzer landscape include Yokogawa Electric Corporation, Thorlabs Inc., Viavi Solutions, Exfo Inc., Anritsu Corporation, Adc Corporation, Apex Technologies, Bristol Corporation Inc., Aragon Photonics Brillouin, Finisar Corporation, New Ridge Technologies, Id Photonics, and Yenista Optics.
Global Optical Spectrum Analyzer Market Size
The global optical spectrum analyzer size will reach USD 380 million in 2025 and is anticipated to reach USD 401.28 million in 2026 to reach USD 620.52 million by 2034, growing at a CAGR of 5.60% during the forecast period from 2026 to 2034.
Current Market Definition and Scenario Overview
An Optical Spectrum Analyzer (OSA) is a precision instrument that measures the power and wavelength of light signals. These devices measure parameters such as wavelength power level and signal to noise ratio ensuring the integrity and performance of high speed data transmission infrastructure. The technology relies on diffraction gratings or interferometric methods to disperse light into its constituent wavelengths allowing precise analysis of complex optical spectra. In Europe the deployment of advanced telecommunications infrastructure drives the necessity for rigorous testing and validation tools. According to data from the European Commission, the European Union is actively deploying Very High Capacity Networks (VHCN) across member states to meet its Digital Decade target of 100% gigabit connectivity for all households by 2030. As per the International Telecommunication Union (ITU) Facts and Figures, profound digital divides persist in connectivity quality, with the average monthly mobile data traffic per subscription in high-income nations vastly outpacing usage in low-income regions. Regulatory bodies such as the European Conference of Postal and Telecommunications Administrations enforce strict standards for spectral efficiency and interference mitigation in optical communications. The European Space Agency (ESA) is expanding free-space optical laser communication links via its HydRON initiative to extend fiber-like speeds into space, utilizing advanced sky-monitoring systems to mitigate local cloud cover and weather disruptions. The integration of coherent detection technologies in modern networks further elevates the demand for high resolution spectral analysis to manage phase and polarization effects. These factors collectively define the operational landscape for optical spectrum analyzers highlighting their critical role in maintaining the reliability and capacity of next generation optical communication systems across various industrial and scientific applications.
MARKET DRIVERS
Expansion Of 5G Networks And Fiber To The Home Infrastructure
The rapid expansion of 5G networks and Fiber To The Home infrastructure is fuelling the growth of the optical spectrum analyzer market. This is due to the increased complexity and density of optical transmission systems. 5G technology requires dense fronthaul and backhaul networks utilizing fiber optics to support high bandwidth and low latency connections. Telecom operators must ensure that optical signals remain within specified spectral masks to prevent interference and maintain signal quality across multiple channels. Fiber To The Home deployments have accelerated. This widespread rollout necessitates rigorous testing during installation and maintenance phases to verify signal integrity and identify faults. Optical spectrum analyzers are indispensable for measuring channel power levels and identifying nonlinear effects such as four wave mixing which can degrade performance in dense wavelength division multiplexing systems. The transition to higher order modulation formats in 5G transport networks increases the sensitivity to spectral distortions requiring more precise measurement tools. Additionally the proliferation of small cells in urban areas creates a complex mesh of optical links that require continuous monitoring. Service providers rely on portable and handheld optical spectrum analyzers for field technicians to perform quick diagnostics and ensure service level agreements are met. The ongoing upgrades from 4G to 5G and the subsequent evolution to 6G will sustain the demand for advanced spectral analysis capabilities to manage increasingly crowded optical spectra.
Advancements In Coherent Optical Communication Technologies
Advancements in coherent optical communication technologies propel the demand for high performance OSAs capable of analyzing complex modulation formats, which further boosts the expansion of the optical spectrum analyzer market. Coherent detection allows for the transmission of more data over existing fiber infrastructure by encoding information in the amplitude phase and polarization of light waves. The Optical Internetworking Forum (OIF) aim to standardize 800G coherent optical interfaces to handle dense hyperscale data workloads. These advanced systems generate intricate spectral signatures that require high resolution analyzers to distinguish between closely spaced channels and assess signal quality metrics such as error vector magnitude. Traditional optical spectrum analyzers often lack the resolution and dynamic range needed to accurately characterize coherent signals leading to the development of specialized instruments with finer wavelength resolution. The implementation of probabilistic constellation shaping and other digital signal processing techniques further complicates the spectral landscape necessitating sophisticated analysis tools. Data from the IEEE Photonics Society indicates that research into terabit per second transmission rates is accelerating pushing the boundaries of current measurement capabilities. Manufacturers of optical network equipment require precise spectral data to optimize transmitter designs and ensure compliance with international standards. The shift toward open line systems where components from different vendors are integrated also increases the need for standardized and accurate spectral measurements to guarantee interoperability. As network capacity continues to grow, reliance on advanced optical spectrum analyzers to validate and troubleshoot coherent systems is increasingly critical. Consequently, this level of precision is essential for maintaining robust network reliability and overall performance.
MARKET RESTRAINTS
High Cost Of Advanced Instrumentation And Maintenance
The high cost of advanced OSAs and their associated maintenance requirements is hampering the growth of the optical spectrum analyzer market. This trend is particularly prevalent among small and medium sized enterprises and educational institutions. High resolution instruments capable of analyzing coherent signals and wide spectral ranges often command prices exceeding 50000 dollars making them prohibitive for budget constrained organizations. The complexity of these devices also necessitates regular calibration and specialized maintenance which adds to the total cost of ownership. Service contracts for premium optical spectrum analyzers can cost up to 10 percent of the initial purchase price annually creating a recurring financial burden. Small telecom operators and independent network integrators may opt for lower cost alternatives or rent equipment instead of purchasing which limits market penetration for high end manufacturers. Additionally the rapid pace of technological obsolescence means that instruments may need replacement or significant upgrades within a few years to keep up with new communication standards. Also, the SPIE Global Salary Survey highlights core labor costs, workplace benefits, and demographic movements affecting the international optics workforce. The scarcity of trained personnel who can operate and interpret data from advanced optical spectrum analyzers further increases operational costs. These financial barriers restrict the widespread adoption of high performance spectral analysis tools slowing down innovation and quality assurance in smaller segments of the optical industry.
Technical Complexity And Requirement For Specialized Expertise
The technical complexity of modern OPAs and the requirement for specialized expertise to operate them are substantial constraints for users and manufacturers alike, which hinders the expansion of the optical spectrum analyzer market. Contemporary instruments incorporate advanced features such as polarization analysis high speed scanning and automated measurement sequences which require a deep understanding of optical physics and signal processing. Misinterpretation of spectral data can lead to incorrect diagnoses of network issues resulting in prolonged downtime and increased operational costs. The steep learning curve associated with high end optical spectrum analyzers discourages adoption among generalist IT staff who may lack specific training in optical measurements. Manufacturers must invest heavily in user interface design and comprehensive training programs to mitigate this challenge but these efforts increase product development costs. Furthermore the integration of optical spectrum analyzers with automated test systems requires proficiency in programming languages and software interfaces adding another layer of complexity. The rapid evolution of measurement standards and protocols means that users must continuously update their knowledge to remain effective. This dependency on specialized human capital limits the scalability of optical testing operations and creates bottlenecks in network deployment and maintenance workflows. Addressing this challenge requires industry wide initiatives to enhance education and certification programs for optical testing professionals.
MARKET OPPORTUNITIES
Integration With Artificial Intelligence For Automated Signal Analysis
The integration of artificial intelligence and machine learning algorithms into OSAs sets the stage for enhancing measurement efficiency and diagnostic accuracy, which is likely to promote the growth of the optical spectrum analyzer market. AI driven software can automatically identify anomalies classify signal types and predict potential failures based on historical spectral data reducing the need for manual interpretation. The automation allows for real time monitoring of large scale optical networks where manual analysis would be impractical due to the volume of data generated. Machine learning models can be trained to recognize subtle spectral patterns indicative of specific hardware degradations or environmental disturbances enabling proactive maintenance. The ability to process vast amounts of spectral data quickly also supports the optimization of network resources by dynamically adjusting channel allocations based on current traffic demands. Manufacturers are developing smart optical spectrum analyzers that offer predictive insights and automated reporting features appealing to operators seeking to reduce operational expenditures. The convergence of edge computing and AI enables these intelligent instruments to perform complex analyses locally without relying on cloud connectivity ensuring low latency responses. As optical networks become more dynamic and software-defined, the demand for intelligent measurement tools will continue to grow. This growth will offer substantial value to service providers and equipment manufacturers.
Development Of Portable And Handheld Testing Solutions
The development of portable and handheld OSAs offers substantial opportunities for growth of the optical spectrum analyzer market. This expands the reach of the market into field service and remote monitoring applications. Traditional benchtop instruments are bulky and require stable power sources limiting their utility in outdoor or confined spaces. Compact handheld devices equipped with battery power and ruggedized designs enable technicians to perform spectral measurements directly at fiber termination points and remote nodes. Program data from the Fiber Optic Association (FOA) emphasizes scaling accessible technical certifications to prepare a field workforce capable of managing dense network expansions. These portable solutions facilitate faster deployment and troubleshooting of Fiber To The Home and 5G small cell networks where accessibility is often challenging. Advances in miniaturization and photonic integrated circuits have allowed manufacturers to maintain high performance specifications in smaller form factors without compromising accuracy. The ability to sync data from handheld devices to cloud based management platforms ensures that field findings are immediately available to central engineering teams for analysis. This connectivity enhances collaboration and accelerates resolution times for network issues. As network densities increase in urban and rural areas, the demand for agile and reliable portable testing equipment will rise. This equipment will support the efficient maintenance of expansive optical infrastructures.
MARKET CHALLENGES
Calibration Standards And Measurement Traceability Issues
Calibration standards and measurement traceability issues are significant challenges for the optical spectrum analyzer market. As a result, inconsistencies can lead to unreliable data and regulatory non-compliance. Accurate spectral measurements require regular calibration against reference standards maintained by national metrology institutes but access to these services can be limited and expensive. Lack of uniform calibration protocols across regions creates difficulties for multinational companies that need to ensure consistent measurement quality across global operations. The absence of widely accepted standards for newer modulation formats and coherent signals further complicates the calibration process. This gap undermines confidence in measurement results and can lead to disputes between equipment vendors and network operators regarding performance specifications. Additionally the drift in instrument performance over time due to environmental factors such as temperature and humidity requires frequent recalibration which disrupts workflow. Manufacturers face pressure to develop self calibrating instruments or provide more accessible calibration services but these solutions add complexity and cost. Ensuring global harmonization of calibration standards is essential for fostering trust and interoperability in the optical communications industry.
Rapid Technological Obsolescence And Product Lifecycle Management
Rapid technological obsolescence and the short product lifecycle of OPAs are persistent barriers for manufacturers and users in the fast-evolving photonics sector, which slows down the expansion of the optical spectrum analyzer market. The continuous advancement of optical communication standards such as the transition from 100 Gigabit to 800 Gigabit and beyond renders older measurement instruments incapable of characterizing new signal formats effectively. The accelerated obsolescence forces users to frequently upgrade or replace their instruments imposing significant capital expenditure burdens. Manufacturers struggle to balance the development of new features with the support of legacy products leading to fragmented product portfolios and increased support costs. The pressure to innovate constantly also strains research and development resources potentially compromising product quality or reliability. Users face uncertainty when investing in expensive equipment knowing that it may become outdated quickly. This dynamic creates a hesitant buying environment where customers may delay purchases or opt for rental models instead. Managing this rapid turnover requires strategic planning from both suppliers and buyers to ensure that measurement capabilities remain aligned with current and future network requirements without excessive financial.
REPORT COVERAGE
| REPORT METRIC | DETAILS |
| Market Size Available | 2025 to 2034 |
| Base Year | 2025 |
| Forecast Period | 2026 to 2034 |
| CAGR | 5.6% |
| Segments Covered | By Product Type, Mode Type, End Use, and Region |
| Various Analyses Covered | Global, Regional, & Country Level Analysis, Segment-Level Analysis, DROC, PESTLE Analysis, Porter’s Five Forces Analysis, Competitive Landscape, Analyst Overview on Investment Opportunities |
| Regions Covered | North America, Europe, APAC, Latin America, Middle East & Africa |
| Market Leaders Profiled | Yokogawa Electric Corporation, Thorlabs Inc., Viavi Solutions, Exfo Inc., Anritsu Corporation, Adc Corporation, Apex Technologies, Bristol Corporation Inc., Aragon Photonics Brillouin, Finisar Corporation, New Ridge Technologies, Id Photonics And Yenista Optics and Others. |
SEGMENTAL ANALYSIS
By Type Insights
The benchtop OPAs segment led the global market and captured a substantial share in 2025. This leading position of the segment was attributed to its superior performance metrics including high resolution wide dynamic range and exceptional accuracy which are critical for research and development laboratories. These instruments are indispensable in manufacturing facilities of original equipment manufacturers where precise characterization of complex optical components such as coherent transceivers and dense wavelength division multiplexing modules is required. The ability to integrate these devices into automated test systems allows for high throughput quality control which is essential for mass production of fiber optic components. Moreover, the Semiconductor Industry Association (SIA) show global chip sales demonstrating strong cyclical performance, pulling forward major investments in silicon photonics infrastructure that mandate deep spectral validation. Benchtop analyzers also support advanced measurement modes such as polarization analysis and phase noise detection which are not feasible with portable or handheld alternatives. Research institutions and universities heavily rely on these robust instruments for pioneering work in quantum communications and nonlinear optics. The long operational lifespan and upgradability of benchtop models make them a cost effective investment for organizations requiring consistent and reliable data over extended periods. As optical networks evolve toward higher capacities, the demand for unparalleled precision increases. Consequently, benchtop analyzers ensure their continued dominance in the professional testing landscape.
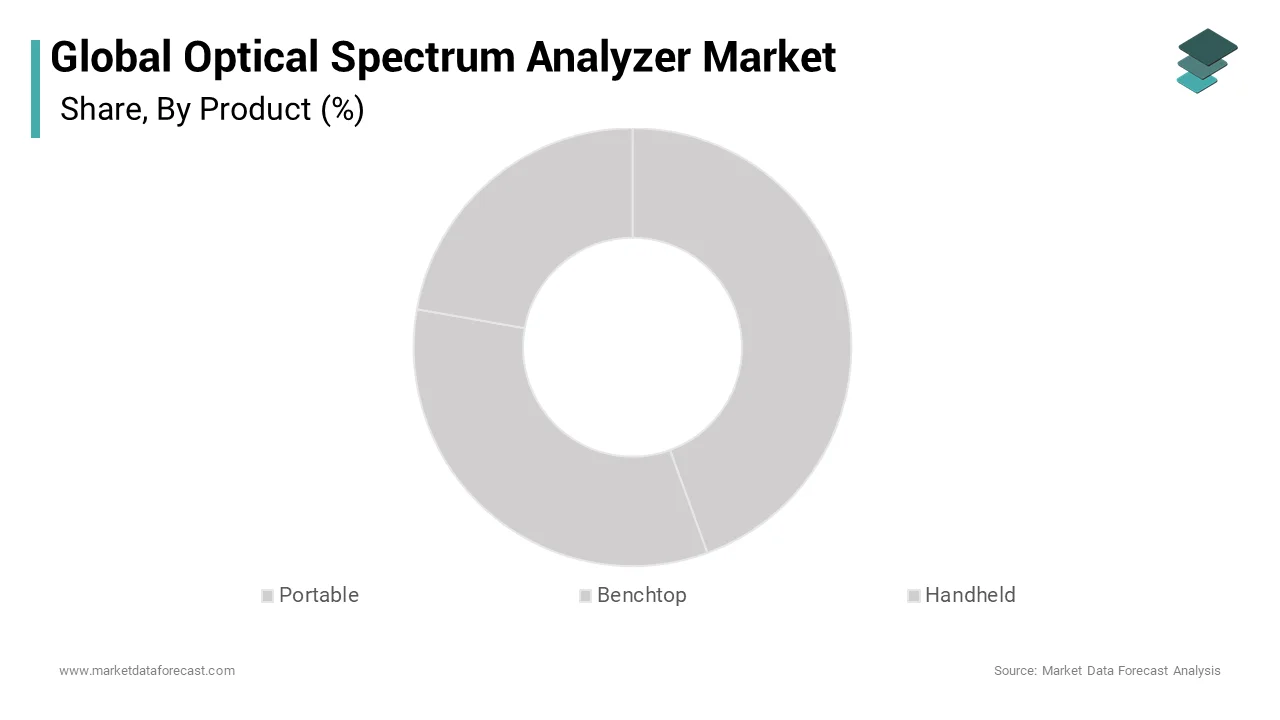
On the other hand, the handheld OPAs segment is on the rise and is expected to be the fastest growing segment in the market by witnessing a CAGR of 8.9% during the forecast period due to the urgent need for field technicians to perform accurate spectral measurements during the installation and maintenance of Fiber To The Home and 5G networks. Unlike bulky benchtop units handheld devices offer portability battery operation and ruggedized designs suitable for harsh outdoor environments. The deployment of passive optical networks has surged with the European Commission reporting that 56 percent of EU households had access to full fiber connectivity in 2024 creating a massive demand for field testing tools. Technicians require immediate feedback on signal power wavelength and signal to noise ratio to troubleshoot issues without returning to a laboratory. Advances in miniaturization have allowed manufacturers to embed high performance diffraction gratings and detectors into compact form factors without compromising essential accuracy. The integration of wireless connectivity enables real time data upload to cloud based management platforms facilitating remote expert assistance and efficient workflow management. As network densities increase in urban and rural areas, handheld analyzers have become the preferred choice for last mile connectivity projects. This convenience and efficiency are driving their accelerated adoption rates globally.
By Mode Insights
In 2025, the spectrometer mode segment held the majority share of the optical spectrum analyzer market because of its versatility and ability to provide comprehensive spectral analysis across a wide wavelength range. This mode is essential for characterizing broadband light sources such as superluminescent diodes and erbium doped fiber amplifiers which are fundamental components in modern optical communication systems. Academic publications supported by Optica demonstrate that utilizing spectrometer diagnostic modes provides critical wavelength resolution, enabling lab teams to isolate spectral shape and side-mode suppression ratios. The capability to resolve closely spaced wavelengths makes it indispensable for monitoring dense wavelength division multiplexing systems where channel spacing can be as narrow as 50 gigahertz. Spectrometer mode also supports the analysis of nonlinear effects such as four wave mixing and stimulated Raman scattering which can degrade signal quality in long haul transmission links. Research and development laboratories rely on this mode for developing new laser sources and optical filters requiring precise spectral profiling. The widespread adoption of spectrometer mode is further reinforced by its compatibility with various optical interfaces and ease of integration into existing test benches. Optical networks are becoming increasingly complex. As a result, the detailed spectral visualization provided by spectrometer mode ensures its continued leadership in the market.
However, the wavelength meter mode segment is expected to exhibit a noteworthy CAGR of 7.5% from 2026 to 2034 owing to the increasing demand for ultra precise wavelength measurement in coherent optical communication systems and laser manufacturing. Wavelength meters offer superior accuracy compared to standard spectrometers often achieving precision levels below 1 picometer which is critical for stabilizing lasers in high speed data transmission. The adoption of coherent transceivers operating at 400 gigabit and 800 gigabit speeds requires exact wavelength alignment to minimize phase noise and maximize spectral efficiency. Wavelength meter mode is particularly valuable in calibration laboratories and production lines where absolute wavelength accuracy is mandatory for regulatory compliance. The rise of silicon photonics and integrated optical circuits also contributes to this trend as these technologies require precise characterization of resonant wavelengths. Manufacturers are enhancing wavelength meter capabilities with faster acquisition times and automated calibration features to meet the demands of high volume production. As optical networks transition to finer channel grids and more complex modulation formats, high-precision wavelength measurement becomes essential. This reliance will continue to accelerate the growth of the segment.
By End User Insights
The telecommunication operators and OEMs segment dominated the optical spectrum analyzer market and accounted for a significant share in 2025. This dominance of the segment was driven by the continuous expansion and upgrading of global fiber optic networks. These entities require extensive testing capabilities to ensure network reliability optimize performance and comply with industry standards during both deployment and maintenance phases. Telecom operators utilize optical spectrum analyzers to monitor signal quality identify faults and manage wavelength allocation in dense wavelength division multiplexing systems. Original equipment manufacturers rely on these instruments for quality control during the production of optical transceivers amplifiers and multiplexers ensuring that each component meets strict performance criteria. The transition to 5G and beyond necessitates dense fronthaul and backhaul networks which increase the complexity of optical testing requirements. Regulatory mandates for spectral efficiency and interference mitigation further drive the adoption of advanced analytical tools. The scale of operations for major telecom providers and OEMs ensures consistent and high volume demand for both benchtop and portable optical spectrum analyzers. As networks evolve toward software-defined architectures, the need for precise physical layer monitoring remains paramount. This ongoing need sustains the dominance of this segment.
On the other hand, the consumer electronics and photonics devices segment is predicted to witness the highest CAGR of 9.2% between 2026 and 2034. This quick surge is fuelled by the proliferation of photonic sensors in smartphones wearables and automotive applications such as LiDAR systems for autonomous driving. These devices rely on precise optical components including vertical cavity surface emitting lasers and photodetectors which require accurate spectral characterization during manufacturing. A study confirms that annual smartphone shipments reached approximately 1.2 billion units, creating high-volume factory testing demands for VCSEL arrays and advanced infrared sensing components. Photonics devices used in virtual reality headsets and augmented reality glasses also necessitate rigorous spectral analysis to ensure color accuracy and brightness uniformity. Manufacturers of these compact optical modules require specialized optical spectrum analyzers that can handle small form factor components and provide rapid measurement cycles. The integration of biometric sensors and facial recognition systems further expands the application scope for spectral testing. As consumer expectations for device performance and reliability increase the emphasis on quality control through precise optical measurement drives the rapid adoption of analyzers in this sector.
REGIONAL ANALYSIS
North America Market Analysis
North America was the top performer in the global optical spectrum analyzer market and captured a 32.7% share in 2025. This supremacy of the North American market was propelled by advanced technological infrastructure and significant investment in research and development. The United States serves as the primary market with a strong presence of leading telecommunications companies and optical equipment manufacturers. Official data from the Federal Communications Commission (FCC) demonstrates that 95% of U.S. households and small businesses have gained access to fixed broadband services meeting modern benchmark speeds. The region benefits from substantial government funding for scientific research through agencies such as the National Science Foundation which supports the development of next generation photonic technologies. Also, the Semiconductor Industry Association (SIA) shows that U.S. semiconductor firms capture nearly half of global revenue share, driven heavily by global consumer and enterprise computing demand. The presence of major technology hubs in Silicon Valley and Boston fosters innovation in optical communications and sensing applications. Early adoption of 5G technology and ongoing preparations for 6G networks drive demand for high precision testing equipment. Additionally the robust defense sector utilizes optical spectrum analyzers for secure communication systems and lidar applications. Strong intellectual property protection and a skilled workforce further enhance the region's competitiveness. These factors collectively sustain North America's leadership in the optical spectrum analyzer market by fostering an environment conducive to technological advancement and high value manufacturing.
Europe Market Analysis
Europe was the next prominent region in the optical spectrum analyzer market and occupied a 28.1% share in 2025. This growth of the European market was fuelled by stringent regulatory standards and ambitious digital transformation goals. Initiatives like the European Gigabit Society drive this share by targeting full household gigabit connectivity by 2030. According to connectivity indicators from Eurostat, full-fiber infrastructure coverage has expanded across the European Union as member states deploy fiber networks to hit regional gigabit society goals. The European Union General Data Protection Regulation and other cybersecurity frameworks impose strict requirements on network reliability and data integrity prompting operators to invest in advanced monitoring tools. Germany France and the United Kingdom are key markets with strong automotive and manufacturing sectors that utilize photonic sensors for automation and quality control. The region is also a leader in quantum communication research requiring highly specialized spectral analysis equipment. Collaborative projects among European nations facilitate the harmonization of technical standards and promote cross border interoperability. The emphasis on sustainability and energy efficiency drives the adoption of optimized optical networks that reduce power consumption. These dynamics ensure that Europe remains a critical market for high quality and compliant optical spectrum analyzers.
Asia Pacific Market Analysis
The Asia Pacific region is a rapidly growing region in the optical spectrum analyzer market due to swift urbanization massive infrastructure investments and expanding manufacturing capabilities. China India Japan and South Korea are key contributors with China serving as the global hub for optical component production. According to the Asian Development Bank infrastructure investment in the region is expected to reach 1.7 trillion dollars annually through 2030 supporting the expansion of high speed broadband networks. The Chinese Ministry of Industry and Information Technology reported that the number of 5G base stations exceeded 3 million in 2024 creating substantial demand for testing equipment to ensure network performance. India Digital India initiative aims to connect rural areas with high speed internet driving the rollout of fiber optic cables that require spectral validation. Japan and South Korea lead in technological innovation with strong focus on robotics and automotive industries that utilize advanced photonic sensors. The rising middle class and increasing smartphone penetration further stimulate demand for consumer electronics featuring optical components. Government support for semiconductor and photonics industries fosters local manufacturing and reduces dependence on imports. These factors create a vibrant ecosystem for sustained growth in the Asia Pacific optical spectrum analyzer market.
Latin America Market Analysis
Latin America grew steadily in the global optical spectrum analyzer market owing to improving telecommunications infrastructure and increasing internet penetration in key countries. Brazil and Mexico are the primary markets in the region benefiting from government initiatives to expand broadband access and modernize digital services. According to the Inter American Development Bank digital inclusion programs have increased internet access in rural areas creating new opportunities for fiber optic deployment. Telecom operators in the region are investing in network modernization to support higher data speeds and improved service quality which requires reliable testing equipment. The manufacturing sector in Mexico benefits from nearshoring trends with companies establishing production facilities that require quality control tools for optical components. While economic volatility poses challenges the long term trend toward digitalization supports gradual market expansion. Local partnerships with international equipment suppliers facilitate technology transfer and improve access to advanced testing solutions. The growing awareness of network reliability and performance among consumers and businesses drives demand for professional grade optical spectrum analyzers.
Middle East And Africa Market Analysis
The Middle East and Africa region is anticipated to grow notably in the global optical spectrum analyzer market during the forecast period due to smart city projects and telecommunications modernization in Gulf countries. Saudi Arabia and the United Arab Emirates lead in adoption due to significant investments in digital infrastructure and diversification strategies away from oil dependence. According to the World Bank digital transformation initiatives in the Middle East are accelerating with governments prioritizing efficient supply chains and high speed connectivity. The Saudi Vision 2030 plan includes massive investments in smart cities such as Neom which require advanced optical networks for intelligent transportation and utility management. In Africa the market is smaller but growing in key economies like South Africa and Kenya where mobile money and digital services drive demand for reliable connectivity. The rollout of fiber optic backbones in major African cities creates opportunities for testing and maintenance services. International telecom operators entering the region bring advanced testing practices and equipment raising overall standards. The harsh environmental conditions in some areas necessitate ruggedized and reliable testing tools. As economic diversification continues and digital access improves the potential for optical spectrum analyzer adoption in the Middle East and Africa will increase steadily.
COMPETITIVE LANDSCAPE
The competition in the optical spectrum analyzer market is intense and characterized by the presence of established multinational corporations alongside specialized niche manufacturers. Leading companies leverage their extensive patent portfolios and brand recognition to dominate the high end segment used for research and development. They focus on differentiation through superior technical specifications such as resolution accuracy and speed. Smaller players compete by offering cost effective solutions for routine maintenance and field testing applications. Price competition is significant in the mid range segment prompting manufacturers to optimize production costs and supply chain efficiency. Innovation remains a key battleground as firms race to support new communication standards like 6G and terabit transmission. Strategic alliances with software developers enhance the value proposition through advanced analytics and automation features. Regulatory compliance and calibration standards act as barriers to entry ensuring that only reputable players with rigorous quality control can operate. Customer loyalty is driven by reliability after sales support and ease of integration. The market sees continuous consolidation as larger entities acquire innovative startups to expand their technological capabilities. Emerging economies present growth opportunities but require adaptable strategies to address local infrastructure and budget constraints.
KEY MARKET PARTICIPANTS
Major Key Players in the Global Optical Spectrum Analyzer Market are
- Yokogawa Electric Corporation
- Thorlabs Inc
- Keysight Technologies Inc
- Viavi Solutions
- Exfo Inc
- Anritsu Corporation
- Adc Corporation
- Apex Technologies
- Bristol Corporation Inc
- Aragon Photonics Brillouin
- Finisar Corporation
- New Ridge Technologies
- Id Photonics
- Yenista Optics amongst others
Top Players In The Global Market
- Keysight Technologies Inc stands as a global leader in the optical spectrum analyzer market providing high precision instruments for telecommunications and research applications. The company leverages its extensive expertise in electronic measurement to deliver advanced solutions that address complex coherent optical testing needs. Recent initiatives include the launch of next generation modular platforms that support higher bandwidths and faster analysis speeds for 800 gigabit networks. Keysight actively invests in software defined instrumentation allowing customers to upgrade capabilities without hardware replacement. Their strategic partnerships with major semiconductor manufacturers enable integrated testing solutions for photonic integrated circuits. By focusing on automation and artificial intelligence integration Keysight enhances diagnostic accuracy and reduces testing time. These efforts reinforce its position as a trusted partner for organizations seeking cutting edge optical measurement technologies that ensure network reliability and performance efficiency across diverse industrial sectors worldwide.
- Anritsu Corporation plays a pivotal role in the optical spectrum analyzer market by offering robust and portable testing solutions tailored for field technicians and laboratory engineers. The company focuses on delivering user friendly instruments that combine high accuracy with rugged durability for harsh environments. Recent actions include the expansion of its handheld product line with enhanced connectivity features for real time data sharing and remote monitoring. Anritsu prioritizes innovation in miniaturization technology enabling compact devices to maintain laboratory grade performance standards. The company also strengthens its global support network through training programs and technical assistance services. By addressing the specific needs of fiber optic network deployment and maintenance Anritsu builds strong customer loyalty. Their commitment to quality and reliability ensures that their products meet the stringent requirements of modern optical communication systems. This customer centric approach solidifies its reputation as a key provider of essential testing equipment for the evolving telecommunications infrastructure.
- Yokogawa Electric Corporation
- Yokogawa Electric Corporation contributes significantly to the optical spectrum analyzer market through its comprehensive portfolio of high performance measurement instruments designed for industrial and scientific applications. The company emphasizes precision stability and long term reliability in its product designs catering to demanding research and development environments. Recent developments include the introduction of advanced spectral analysis software that integrates machine learning algorithms for automated fault detection and signal characterization. Yokogawa actively collaborates with academic institutions and research centers to drive innovation in quantum optics and photonics. The company also expands its manufacturing capabilities to meet growing global demand while maintaining strict quality control standards. By focusing on sustainability and energy efficiency Yokogawa aligns its operations with global environmental goals. Their dedication to technological excellence and customer support strengthens its market presence. These strategic moves ensure that Yokogawa remains a preferred choice for professionals requiring accurate and dependable optical measurement solutions for critical infrastructure projects.
Top Strategies Used By Key Market Participants
Key players in the optical spectrum analyzer market primarily focus on continuous innovation and strategic collaborations to maintain competitive advantage. Companies invest heavily in research and development to create instruments with higher resolution wider dynamic range and faster processing speeds. Integration of artificial intelligence and machine learning into software platforms enhances automated analysis and predictive maintenance capabilities. Manufacturers also prioritize portability and ruggedness to cater to field service technicians working in diverse environments. Strategic partnerships with telecommunications operators and semiconductor manufacturers facilitate co development of customized testing solutions. Expansion into emerging markets through localized support and distribution networks helps capture new growth opportunities. Additionally firms emphasize cybersecurity and data integrity to build trust among enterprise clients. These multifaceted strategies ensure sustained relevance and leadership in a rapidly evolving technological landscape characterized by increasing demand for precision and efficiency in optical network management and development.
MARKET SEGMENTATION
This research report on the global optical spectrum analyzer market is segmented and sub-segmented into the following categories.
By Product Type
- Portable
- Benchtop
- Handheld
By Mode Type
- Spectrometer Mode
- Wavelength Meter Mode
By End Use
- IT & Telecommunication
- Medical & Healthcare
- Energy & Utilities
- Automotive
- Institutions
- Aerospace & Defence
- Semiconductors & Electronics
By Region
- North America
- Europe
- Asia-Pacific
- Latin America
- The Middle East and Africa