U.S. Baseball Equipment Market Size, Share, Trends & Growth Forecast Report By Type, By Distribution Channel, and By Country (California, Texas, Florida, New York, Illinois & Rest of the United States) – Industry Analysis and Forecast, 2026 to 2034
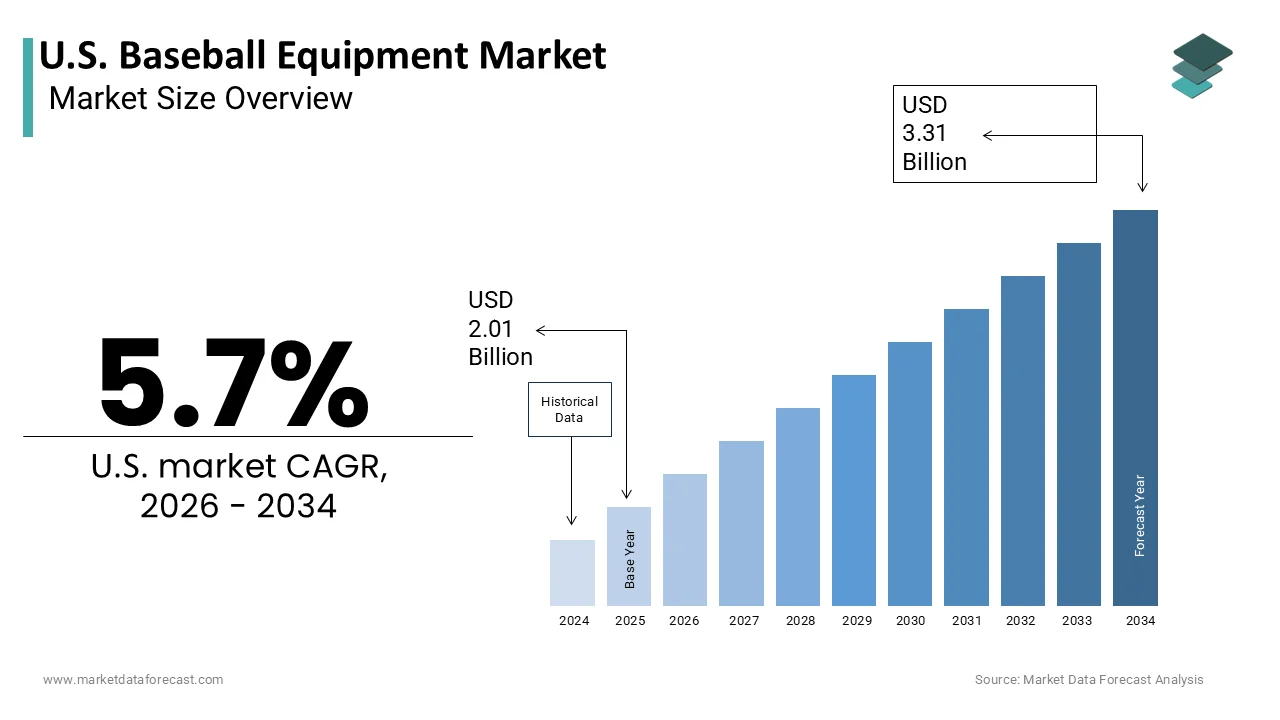
Market Size, 2025
$2.01 BnMarket Estimate, 2026
$2.12 BnMarket Forecast, 2034
$3.31 BnCAGR, 2026–2034
5.7%U.S. Baseball Equipment Market Size
The U.S. Baseball Equipment Market is projected to grow from USD 2.01 billion in 2025 to USD 2.12 billion in 2026 and reach USD 3.31 billion by 2034, registering a CAGR of 5.7% during the forecast period from 2026 to 2034.
The baseball equipment is gear designed for player protection, performance enhancement,t and game facilitation, including bats, ts gloves, helmets, cleats, and protective padding. The definition extends beyond professional leagues to include extensive youth, amateur, and collegiate participation, which drives consistent demand for specialized gear. As per the National Federation of State High School Associations, approximately 482000 boys participated in high school baseball during the 2022-2023 academic year, indicating a robust institutional foundation for equipment sales. According to the Centers for Disease Control and Prevention, baseball and softball are among the leading causes of sports-related emergency department visits for children, emphasizing the necessity for certified protective gear, such as helmets and chest protectors. The integration of advanced materials like composite alloys and moisture-wicking fabrics has transformed product offerings, catering to both performance metrics and durability.
MARKET DRIVERS
Strong Institutional Participation In Youth And High School Leagues
The entrenched institutional participation in youth and high school leagues, which creates a consistent and recurring demand for gear, is propelling the growth of the United States baseball equipment market. According to Little League International, there are over 2 million participants registered globally,y with a significant majority located in the United States, es ensuring a steady baseline of consumers entering the sport annually. Each new season necessitates the purchase or replacement of items, such as gloves, bats, and uniforms, due to growth, wth wear and tear, or regulatory changes. Data from the Aspen Institute indicates that families spend an average of 500 to 1000 dollars per child annually on youth sports equipment, with baseball ranking among the higher cost categories due to the specificity of required gear. The progression from tee ball to competitive travel teams further amplifies this demand as players require higher-quality and specialized equipment to meet performance standards. Schools and leagues often enforce strict safety regulations requiring certified helmets and face guards, which drives sales of compliant products. The adoption of new safety standards for helmets has led to widespread replacement cycles in schools and clubs. This institutional framework ensures that equipment purchases are not merely discretionary but essential for participation,n sustaining market volume regardless of broader economic fluctuations.
Technological Advancement in Performance-Enhancing Gear
Technological innovation in material science and design, as players seek competitive advantages through superior gear, is fuelling the growth of the United States baseball equipment market. Manufacturers continuously develop advanced composite bats,s lighter yet stronger gloves, es and aerodynamic balls that enhance player performance and safety. According to USA Baseball, the implementation of the USABat standard in 2018 required significant upgrades in bat technology to mimic the performance of wood bats while maintaining durability,ity driving a surge in replacement purchases. Modern bats utilize carbon fiber and alloy composites that optimize swing speed and power transfer,sfer appealing to serious athletes. Similarly, advancements in glove manufacturing, such as synthetic leather blends and improved padding technologies, offer greater durability and comfort, breaking in over time. The integration of sensor technology in equipment, allowing players to track swing metrics and ball exit velocity,y has also emerged as a niche but growing segment. The smart bats and sensors are increasingly adopted by training facilities and elite players seeking data-driven improvements. This continuous cycle of innovation encourages players to upgrade their equipment regularly to stay competitive.
MARKET RESTRAINTS
High Cost Of Participation And Economic Sensitivity
The substantial financial burden for middle- and lower-income families is significantly limiting the growth of the United States baseball equipment market. Baseball is often cited as one of the more expensive youth sports due to the cumulative costs of equipment, league fees, travel, and coaching. According to a survey, the average annual cost for a child to play baseball can exceed 1000 dollars when including travel tournaments and specialized gear. This high barrier to entry limits the potential customer base and restricts frequent upgrades to premium equipment. Economic downturns or inflationary pressures further exacerbate this issue as families prioritize essential expenditures over recreational spending. The reliance on travel baseball circuits, which require extensive equipment kits, adds to the financial strain, making the sport less accessible to diverse socioeconomic groups. Additionally, the rapid obsolescence of equipment due to changing regulations or growth spurts forces families into recurring expense cycles that may become unsustainable.
Declining Youth Participation Rates In Traditional Formats
The gradual decline in youth participation rates in traditional organized baseball compared to other sports is additionally hindering the growth of the United States baseball equipment market. Younger generations are increasingly drawn to faster-paced individual sports, such as soccer, basketball, and lacrosse, which require less specialized equipment and offer year-round playability. The trend reduces the influx of new players, who traditionally drive entry-level equipment sales. The time commitment required for baseball practices and games is often viewed as prohibitive by modern families with busy schedules, leading to attrition in teenage years. Data from the National Federation of State High School Associations shows that while high school participation remains stable,e the pipeline from youth leagues is shrinking in certain regions. The perception of baseball as a slow or outdated sport further discourages new entrants,s limiting market expansion. As per the Wall Street Journal, the rise of esports and digital entertainment has also competed for the leisure time of young athletes, thus reducing the pool of active participants. This demographic shift forces equipment manufacturers to rely more heavily on replacement sales from existing players rather than new user acquisition.
MARKET OPPORTUNITIES
Expansion Of Women And Softball Equipment Segments
The growing participation of women and girls in baseball and softball through specialized product development is creating new opportunities for the growth of the United States baseball equipment market. While historically male-dominated, these sports are seeing increased female engagement at youth, collegiate,e and professional levels. According to the National Collegiate Athletic Association, over 15000 women participate in collegiate softball annually, thereby creating a substantial demand for gender specific equipment. Manufacturers have the opportunity to design gloves, vests, bats, and cleats tailored to the anatomical differences and performance needs of female athletes, which are often overlooked in unisex designs. Data from USA Softball indicates that registration numbers for girls fastpitch softball have remained resilient, even as traditional baseball participation fluctuates. The introduction of professional women’s baseball leagues, such as Athletes Unlimited,d provides a platform for visibility and inspires younger players to invest in quality gear. Customization options, such as colorways and fit adjustment,s can further differentiate products and attract female consumers. The crossover between baseball and softball equipment also allows manufacturers to leverage existing technologies while adapting them for specific league requirements.
Integration Of Digital Training Tools And Smart Equipment
The integration of digital training tools and smart equipment by Mergerical Gear is expected to be accompanied by data analytics, which is also expected to enhance the growth of the United States baseball equipment market. Players and coaches are increasingly utilizing technology to analyze swing mechanics, pitch velocity, and defensive positioning driving demand for connected devices. Smart bats, real-time with sensors, can provide real time feedb, ack on swing path and exit velocity, allowing players to make immediate adjustments. As per a study, over 90% of professional teams utilize advanced tracking systems influencing grassroots adoption of similar technologies. Manufacturers can partner with tech firms to develop integrated ecosystems where equipment communicates with mobile apps for personalized training programs. The rise of virtual reality training simulations also creates opportunities for bundled hardware and software solutions. As per consumer trends, younger athletes are digital natives who expect technological integration in their sports gear enhancing engagement and retention. The ability to quantify performance improvements through data adds value to equipment purchases justifying premium pricing.
MARKET CHALLENGES
Regulatory Changes And Safety Standard Compliance
Frequent changes in safety regulations and performance standards are quite a challenging factor for the growth of the United States baseball equipment market. Governing bodies, such as USA Baseball and the National Operating Committee, on Standards for Athletic Equipment reg,,ularly upd,, ate specifications for bats helmets and protective gear to enhance player safety and fair play. The transition to the USABat standard required manufacturers to completely redesign their product lines resulting in substantial research and development costs. These regulatory shifts often render existing inventory obsolete forcing companies to write off unsold stock and manage supply chain disruptions. The compliance testing and certification processes can delay product launches by several months impacting seasonal sales windows. The complexity of adhering to varying standards across different age groups and leagues that further complicates production planning. The recalls of non-compliant equipment can damage brand reputation and lead to legal liabilities. Manufacturers must constantly monitor regulatory landscapes and invest in agile manufacturing processes to adapt quickly. The cost of compliance is particularly burdensome for smaller brands that lack the resources for extensive testing and redesign. This regulatory volatility creates uncertainty in product lifecycle management and inventory control. Companies must balance innovation with compliance ensuring that new products meet strict safety criteria without compromising performance.
Counterfeit Products And Intellectual Property Theft
The prevalence of counterfeit baseball equipment undermines brand integrity and poses safety risks to consumers, which also inhibits the growth of the United States baseball equipment market. Illicit manufacturers produce imitation bats, gloves,s and helmets that often fail to meet safety standards, yet are sold at lower prices through unauthorized online channels. The sports apparel and equipment sector is among the most targeted industries for counterfeiting due to high brand value and consumer demand. These fake products not only erode revenue for legitimate manufacturers but also endanger players who rely on gear for protection. Consumers may unknowingly purchase substandard equipment that breaks easily or fails to provide adequate impact resistance, leading to injuries. Brands invest heavily in anti-counterfeit technologies, such as holograms and serial numbers,s but these measures are often circumvented by sophisticated illicit operations. Legitimate companies must allocate resources to legal enforcement and consumer education, instead of diverting funds from innovation and marketing.
REPORT COVERAGE
| REPORT METRIC | DETAILS |
| Market Size Available | 2025 to 2034 |
| Base Year | 2025 |
| Forecast Period | 2026 to 2034 |
| Segments Covered | By Type, Distribution Channel, and Region. |
| Various Analyses Covered | Global, Regional and Country-Level Analysis, Segment-Level Analysis, Drivers, Restraints, Opportunities, Challenges; PESTLE Analysis; Porter’s Five Forces Analysis, Competitive Landscape, Analyst Overview of Investment Opportunities |
| Countries Covered | California, Texas, Florida, New York, and the rest of the United States |
| Market Leaders Profiled | Rawlings Sporting Goods Company, Inc., Wilson Sporting Goods Co., Easton Diamond Sports, LLC, Louisville Slugger (Hillerich & Bradsby Co.), Mizuno Corporation, Marucci Sports, LLC, Victus Sports LLC, Franklin Sports, Inc., Under Armour, Inc., Nike, Inc., All-Star Sporting Goods, Inc., Akadema Inc. |
SEGMENTAL ANALYSIS
By Type Insights
The bats segment accounted in holding 44.8% of the United States baseball equipment market share in 2025 due to their role in offensive performance and the frequent need for replacement or upgrades as players progress through different age groups and skill levels. The strict enforcement of performance standards by governing bodies, which mandates regular equipment upgrades, is also propelling the growth of the segment. Organizations, such as USA Baseball and the National Collegiate Athletic Association,n implement specific bat standards like USABat and BBCOR to ensure player safety and maintain competitive balance. This regulatory shift created a massive replacement cycle that continues to drive sales, as new cohorts of players enter the sport. Furthermore, bats have a limited lifespan due to wear and tear, with composite materials losing performance characteristics after extensive use. Most high-end composite bats require replacement every one to two seasons for active players. The necessity of adhering to league rules ensures that consumers cannot opt for cheaper non-compliant alternatives, sustaining demand for certified products.
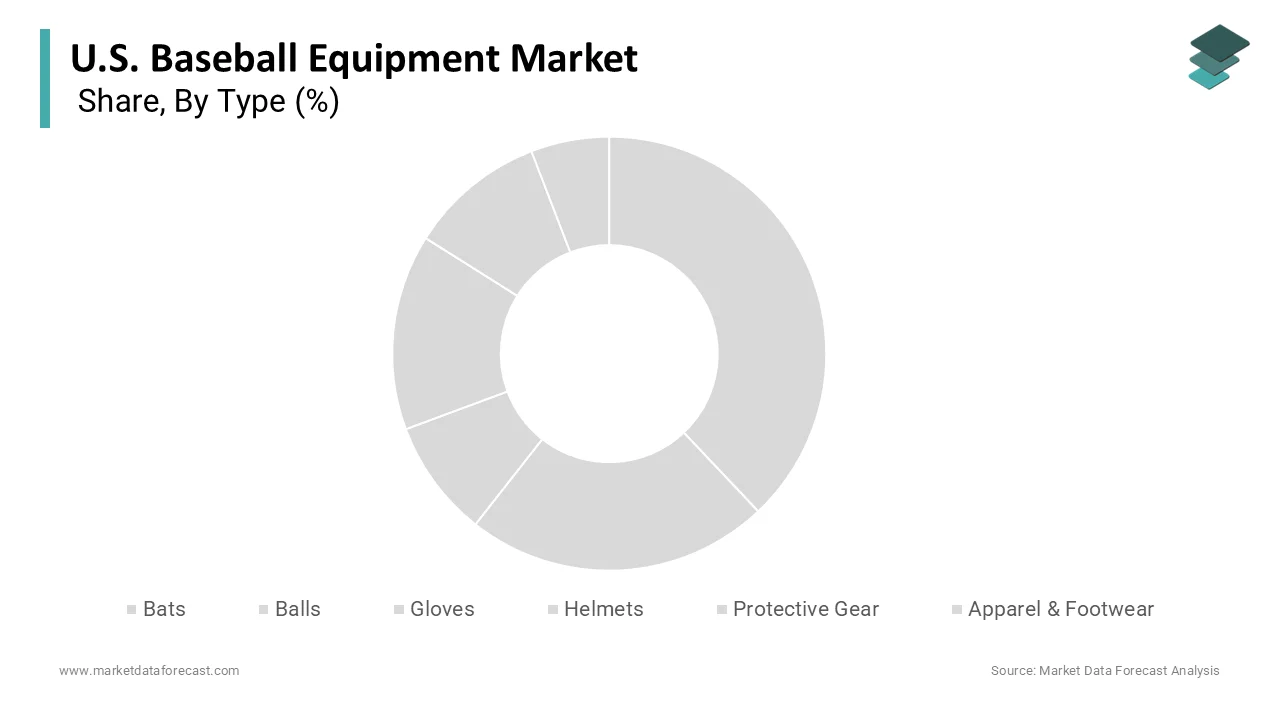
The helmets segment is witnessing the fastest CAGR of 6.5% during the forecast period, owing to the increasing awareness of head injury risks, including concussions and facial trauma, among baseball players. According to the Centers for Disease Control and Prevention, baseball is among the top five sports contributing to traumatic brain injuries in children aged 5 to 14 years. This data has prompted parents, coaches,s and leagues to prioritize head protection, leading to stricter enforcement of helmet usage rules. Many youth leagues now mandate helmets with face guards or cages for all batters and baserunners,s whereas previously only batters were required to wear them. The implementation of NOCSAE standards for helmet performance ensures that consumers seek out certified products that offer superior impact absorption. Schools and clubs are also replacing older inventory with newer, safer models to mitigate liability risks. The teams with updated safety equipment often benefit from lower liability premiums.
By Distribution Channel Insights
The sports stores segment was the dominant one by holding 34.2% of the United States baseball equipment market share in 202,5 owing to the availability of expert guidance and a specialized product assortment that general retailers cannot match. Baseball equipment requires precise fitting, particularly for gloves, bats,t s, and helmets to ensure safety and performance. According to a survey by the National Sporting Goods Association, over 60% of consumers prefer purchasing baseball gear from specialized stores where staff can provide professional advice on sizing and specifications. Knowledgeable employees help customers navigate complex regulations such as bat certifications and helmet standards, reducing the risk of purchasing non-compliant items. Sports stores also carry a wider range of branded models,s including professional-grade equipment that is not available in mass market outlets. The ability to try on gloves and test bat swings in store allows customers to make informed decisions, reducing return rates. Pro shops associated with local leagues and tournaments further reinforce this channel by offering immediate access to gear for participants.
The online e-commerce segment is expected to grow at the fastest CAGR of 8.2% during the forecast period. The primary catalyst for the rapid growth of the online channel is the unparalleled convenience and extensive product selection available to consumers. Shoppers can browse thousands of items from multiple brands and compare prices instantly without leaving home. Online platforms offer access to niche and specialized equipment that may not be stocked by local stores, particularly for rare sizes or specific models. The baseball equipment is among the top searched sporting goods items online due to its variety. The ability to read detailed customer reviews and watch video demonstrations aids decision-making and builds confidence in purchases. According to the study, 55% of younger consumers prefer online shopping for sports gear due to the ease of research and comparison. Home delivery eliminates the need for travel and allows for flexible scheduling, which appeals to busy families. The integration of easy return policies and virtual fitting tools further mitigates the risks associated with online buying.
COMPETITIVE LANDSCAPE
The competition in the United States baseball equipment market is intense and characterized by a mix of established legacy brands and specialized niche manufacturers. Large companies leverage their extensive resources to dominate through broad distribution networks and heavy marketing spending. They continuously innovate to maintain relevance and protect their market positions against newer entrants. Independent brands often differentiate themselves by focusing on specific segments such as custom gloves or high-performance bats. These smaller entities utilize digital channels to build direct relationships with consumers and foster community loyalty. The barrier to entry has lowered due to the rise of e-commerce platforms, ms allowing new players to launch with minimal overhead. This dynamic environment forces all participants to prioritize speed and agility in product development. Price competition is prevalent in the mass market segment, ent while premium brands compete on brand heritage and technological superiority. Retailers play a crucial role by curating assortments that balance popular staples with emerging trends. Private label offerings from major retailers further intensify pressure on branded manufacturers. Consumer loyalty is increasingly fluid as shoppers experiment with new products influenced by social media trends. Companies must therefore maintain constant engagement through educational content and transparent communication. The ability to adapt quickly to regulatory changes and shifting consumer values determines long-term survival.
KEY MARKET PLAYERS
Some of the companies that are playing a dominating role in the U.S. Baseball Equipment Market include
- Rawlings Sporting Goods Company, Inc.
- Wilson Sporting Goods Co.
- Easton Diamond Sports, LLC
- Louisville Slugger (Hillerich & Bradsby Co.)
- Mizuno Corporation
- Marucci Sports, LLC
- Victus Sports LLC
- Franklin Sports, Inc.
- Under Armour, Inc.
- Nike, Inc.
- All-Star Sporting Goods, Inc.
- Akadema Inc.
TOP LEADING PLAYERS IN THE MARKET
- Rawlings Sporting Goods Company Inc maintains a prestigious position in the United States baseball equipment sector as the official supplier of Major League Baseball game balls. The company leverages this exclusive partnership to build immense brand credibility and trust among players at all levels. Recent strategic initiatives include the expansion of its personalized glove program, which allows customers to customize leather colors and stitching patterns online. This direct-to-consumer approach enhances customer engagement and drives higher margin sales. Rawlings also invests heavily in youth leagues and tournaments,s sponsoring events that increase brand visibility among future consumers. The corporation continues to innovate in bat technology by introducing composite models that comply with strict USA Baseball standards. Its extensive distribution network ensures product availability in both specialized pro shops and major retail chains.
- Wilson Sporting Goods Co serves as a dominant force in the United States baseball equipment market through its strong portfolio of brands,nds including A2000 and A2K gloves. The company is renowned for its commitment to quality craftsmanship and performance innovation, ion appealing to serious athletes and professionals. Wilson has also enhanced its digital presence by offering virtual fitting tools and detailed product education content on its website. The corporation actively partners with high-profile professional players who endorse its products, providing powerful marketing leverage. Wilson focuses on sustainability by introducing eco-friendly packaging and responsibly sourced materials in its manufacturing processes. This alignment with environmental values resonates with modern consumers. The company also supports grassroots baseball by funding community programs and coaching clinics.
- Easton Diamond Sports holds a significant share in the United States baseball equipment market,t particularly in the bat and helmet segments. The company is recognized for its cutting-edge engineering and use of advanced composite materials that maximize power and speed. Recent strategic moves include the introduction of new bat models that feature improved balance and larger sweet spots to enhance hitting performance. Easton has also expanded its protective gear line with helmets that offer superior ventilation and impact resistance. The brand actively engages with social media influencers and youth coaches to promote its products and training tips. This digital marketing strategy helps reach younger demographics effectively. Easton collaborates with major retail partners to ensure prominent shelf placement and exclusive product launches. The company prioritizes research and development to stay ahead of regulatory changes and performance trends.
TOP STRATEGIES USED BY KEY MARKET PARTICIPANTS
Key players in the United States baseball equipment market employ several strategic initiatives to maintain competitiveness and drive growth. Product innovation remains a primary strategy with companies investing heavily in research and development to create advanced composite bats and safer helmets. Brands frequently introduce items featuring improved swing weights and impact protection to meet evolving safety standards. Digital transformation is another critical approach as firms enhance their online presence through e-commerce platforms and customization tools. Companies utilize data analytics to offer personalized recommendations and improve customer experiences. Strategic partnerships with professional leagues and athletes help build credibility and reach targeted audiences effectively. Sustainability initiatives are increasingly prominent with firms adopting eco-friendly materials and ethical sourcing practices to appeal to environmentally conscious buyers.
MARKET SEGMENTATION
This research report on the U.S. baseball equipment market is segmented and sub-segmented into the following categories.
By Type
- Bats
- Balls
- Gloves
- Helmets
- Protective Gear
- Apparel & Footwear
- Others
By Distribution Channel
- Sports Stores
- Specialty Stores
- Online E-commerce
- Hypermarkets & Supermarkets
- Others
By Country
- California
- Texas
- Florida
- New York
- Illinois
- Rest of the United States
Related Reports
Access the study in MULTIPLE FORMATS
Purchase options starting from
$ 1200
Didn’t find what you’re looking for?
TALK TO OUR ANALYST TEAM
Need something within your budget?
NO WORRIES! WE GOT YOU COVERED!
Call us on: +1 888 702 9696 (U.S Toll Free)
Write to us: sales@marketdataforecast.com