Global Agricultural Surfactants Market Size, Share, Trends & Growth Forecast Report, Segmented By Type (Anionic, Nonionic, Cationic, And Amphoteric), Stakeholders (Farmers, Producers And Manufacturers), Application (Fungicides, Insecticides, Herbicides And Others), Substrate Type (Synthetic And Bio-based), Fertilizer Type (Nitrogenous, Potassium, & Phosphate) And By Region (North America, Europe, Asia Pacific, Latin America, and Middle East and Africa), Industry Analysis From 2025 to 2033
Global Agricultural Surfactants Market Size
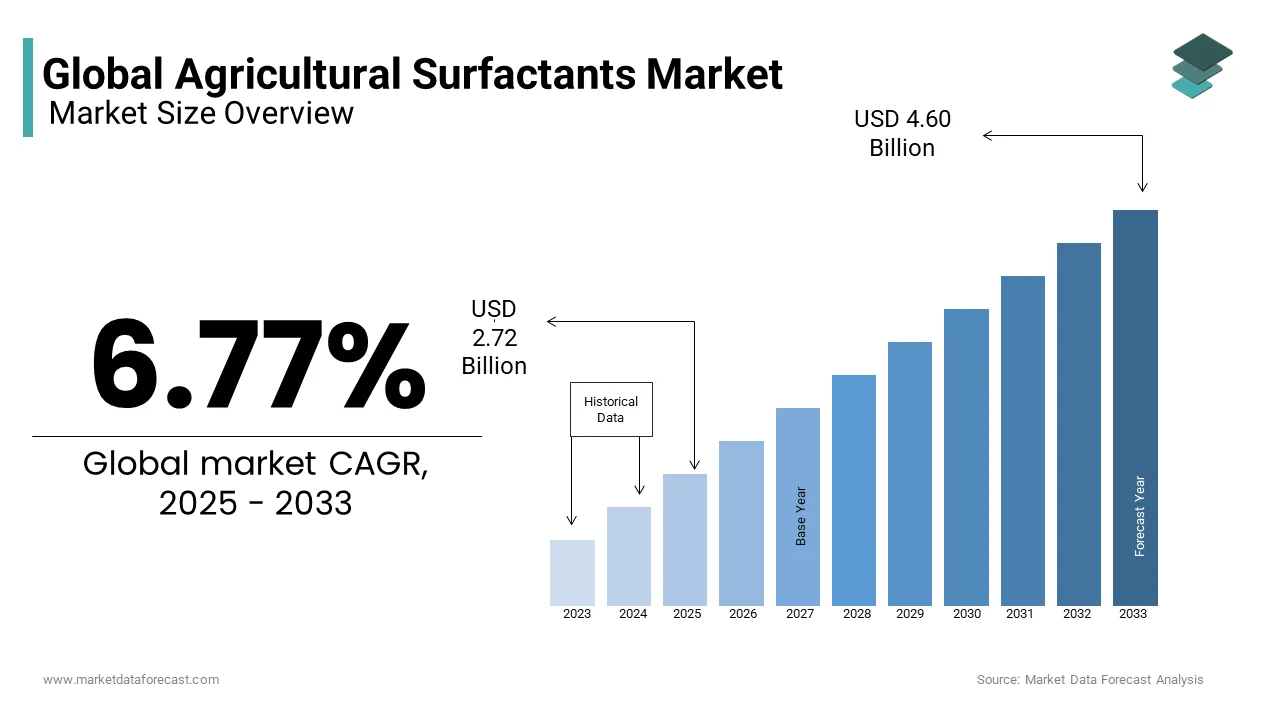
The global agricultural surfactants market was valued at USD 2.55 billion in 2024 and is anticipated to reach USD 2.72 billion in 2025 from USD 4.60 billion by 2033, growing at a CAGR of 6.77% during the forecast period from 2025 to 2033.
Agricultural surfactants are chemicals that enhance or support the action of pesticides such as insecticides, herbicides, and fungicides. The market is expected to have high growth in the next half of the decade since the demand for agricultural chemicals is rising because of increased food demand as a result of the population rise. Agricultural surfactants enhance the activity of pesticides by altering the properties of pesticides like their ability to spread, penetrate the target, increase or decrease the droplet size, and others. This ability of surfactants improves the ability of pesticides to protect or target the organism.
MARKET DRIVERS
The agricultural surfactants market is driven by factors like increased food demand because of the rise in population, development in farming techniques such as precision farming, increasing awareness about the use of chemicals in agriculture, and equipment such as tractors, dusters, sprayers, and increase in commercial agriculture. However, factors like the possibility of pesticide drift, health concerns in using them and their potential harm to the environment are some of the restraints for this market. These factors may act as growth hurdles for the agricultural surfactants market in certain regions.
REPORT COVERAGE
|
REPORT METRIC |
DETAILS |
|
Market Size Available |
2023 to 2032 |
|
Base Year |
2023 |
|
Forecast Period |
2024 to 2032 |
|
CAGR |
6.77% |
|
Segments Covered |
By Type, Application, Substrate Type, Fertilizer Type and Region |
|
Various Analyses Covered |
Global, Regional & Country Level Analysis, Segment-Level Analysis, DROC, PESTLE Analysis, Porter’s Five Forces Analysis, Competitive Landscape, Analyst Overview on Investment Opportunities |
|
Regions Covered |
North America, Europe, APAC, Latin America, Middle East & Africa |
|
Market Leaders Profiled |
Evonik Industries AG (Germany), Akzonobel N.V. (The Netherlands), The Dow Chemical Company (U.S.), BASF SE (Germany), Solvay S.A (Belgium). |
SEGMENTAL ANALYSIS
By Type Insights
The amphoteric category is expected to grow at the highest rate in the next five years whereas the highest market share is of the non-ionic segment.
By Application Insights
The herbicide segment has the largest market share followed by fungicides.
By Substrate Type Insights
Bio-based surfactants are expected to have a higher growth rate in the coming time.
REGIONAL ANALYSIS
In the Global Agricultural Surfactants Market, North America has the largest share with a percentage of 42, followed by a percentage of 23. This market in Europe has good growth as the supply of quality surfactants is increasing from important players. In the Asia-Pacific region, countries like India, China, and Thailand are seen as potential markets by key players owing to factors like a booming economy and rapid adoption of new technologies. Latin America is still in the early stages of the adoption of this technology. Brazil has the largest market share in this region having a share of 58.7 percent.
KEY MARKET PLAYERS
Evonik Industries AG (Germany), AkzoNobel N.V. (The Netherlands), The Dow Chemical Company (U.S.), BASF SE (Germany), Solvay S.A (Belgium). These are market players that are dominate the global agricultural surfactants market.
MARKET SEGMENTATION
This research report on the global agricultural surfactants market is segmented and sub-segmented based on Type, Application, Substrate type, fertilizer type, and Region.
By Type
- Anionic
- Non-ionic
- Cationic and amphoteric
By Application
- Fungicides
- Insecticides
- Herbicides
- Others
By Substrate Type
- Bio-based and synthetic
By Fertilizer Type
- Nitrogenous
- Potassium and phosphate segments
By Region
- North America
- Europe
- Asia Pacific
- Latin America
- Middle East and Africa
Frequently Asked Questions
What are agricultural surfactants and how do they support modern farming?
Agricultural surfactants are additives that improve the effectiveness of agrochemicals (like herbicides, pesticides, and fertilizers) by enhancing their spreading, sticking, and penetration on plant surfaces, leading to better crop protection and nutrient uptake.
What’s driving the global demand for agricultural surfactants?
The surge in demand is fueled by the expansion of precision farming, increasing herbicide resistance in weeds, a need for more efficient crop input delivery, and the global push toward maximizing yields with fewer chemicals.
. What challenges does the global agricultural surfactants market face?
Key challenges include regulatory scrutiny over synthetic chemical use, fluctuating raw material costs, limited awareness among small-scale farmers, and the slower adoption of bio-based surfactants due to higher prices.
What does the future hold for the agricultural surfactants market?
The future is leaning toward bio-based surfactants, customized formulations for specific crops, and integration with smart spraying technologies—all aligning with the shift toward sustainable, precision-driven agriculture.
Related Reports
Access the study in MULTIPLE FORMATS
Purchase options starting from $ 2500
Didn’t find what you’re looking for?
TALK TO OUR ANALYST TEAM
Need something within your budget?
NO WORRIES! WE GOT YOU COVERED!
Call us on: +1 888 702 9696 (U.S Toll Free)
Write to us: [email protected]