- Product Description Description
- Table of Contents TOC
- List of Table & Figure LOT
- Get Free Sample PDF Sample PDF
Global TV Analytics Market Size
The global TV analytics market was worth USD 3.99 billion in 2024. The global market is predicted to expand from USD 4.68 billion in 2025 and USD 16.90 billion by 2033, registering a compound annual CAGR of 17.4% during the forecast period 2025 to 2033.
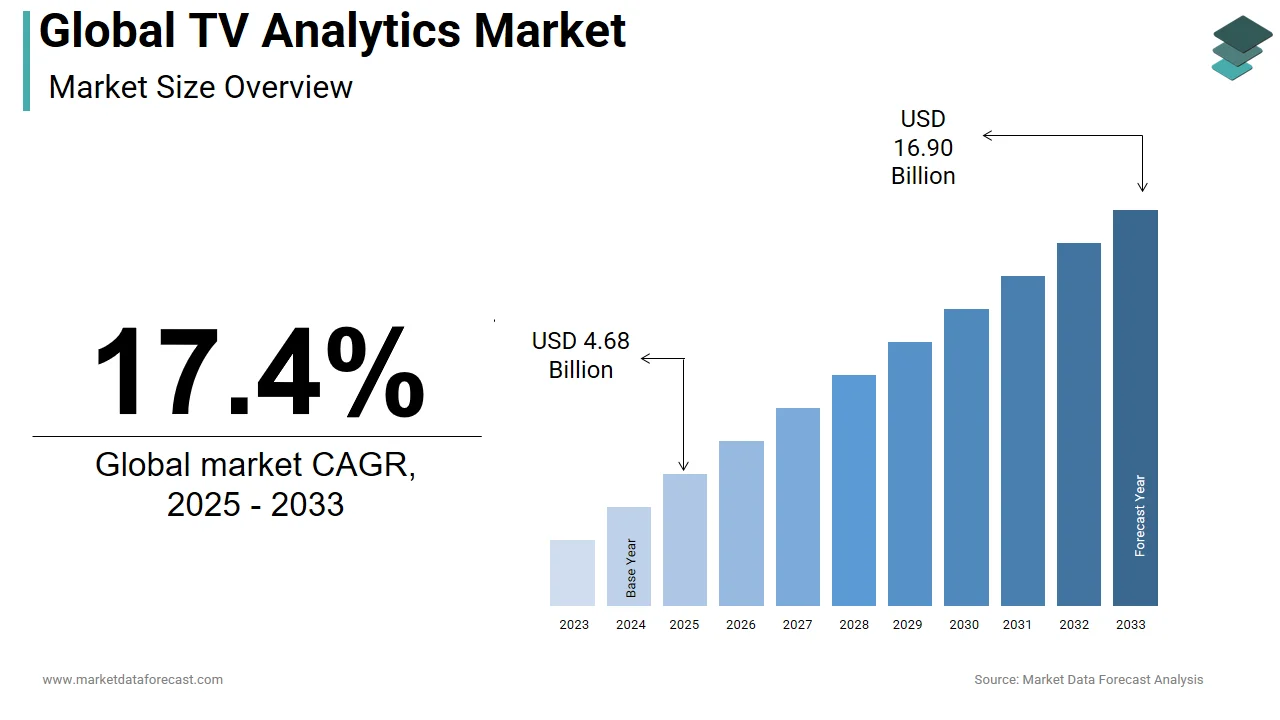
TV analytics can be described as an analytics system that covers viewer preferences and analyzes product and brand exposure for businesses while providing more content from the same viewing content preferred by the audience. The platform analyzes the raw data based on the location from which the user views the content and provides the corresponding analysis to the business. The television advertising landscape has undergone an innovative change in recent times. According to recent reports, 50% of households in the United States use Hulu or Netflix in addition to satellite cable. In addition, these homes spend an average of 5 hours a day watching television. This is a tremendous opportunity for advertisers.
The TV analytics solutions market helps advertisers monitor and analyze numerous aspects of TV services related to user behavior. Companies in the analytics solutions market offer real-time and aggregated data from various channels, including third-party CDNs, mobile devices, and network applications, to provide more information to advertisers.
MARKET DRIVERS
A significant increase in social media usage and its positive impact on brand and product marketing is expected to drive market growth.
Increased intensity related to competition leads to better results, better marketing, and improved analytics, which is also foreseen to promote the global TV analytics market boom. The component segment in this market covers television analysis software and related services. The software segment has overtaken the services segment and will continue the same trend in the coming years because of the hike in adoption. Therefore, professional services such as consulting, support, and maintenance will strengthen over the next five years. With increasing competition in the marketplace and audiences knowing the content, preventing customer loss has become more challenging. Implementing analytics on content and digital platforms helps content developers get a holistic view of their viewers, develop featured programs, and recommend the type of content to viewers.
OTT content providers offer streaming multimedia content over the Internet faster than service providers' other types of content. It gathers information using cookies and implements advanced machine learning and also artificial intelligence (AI) platforms to analyze consumer viewing patterns more profoundly. OTT platform developers use advanced analytics to assess consumer viewing behaviors and organize their particular programs. Netflix makes diverse use of AI and analytics to understand viewer demographics and deliver personalized content to them.
MARKET RESTRAINTS
The lack of digital installed and operational infrastructure needed to process TV analytics is expected to slow market growth. The deficiency of technically qualified and knowledgeable professionals and personnel required to evaluate television analysis processes is also expected to limit this business growth.
REPORT COVERAGE
| REPORT METRIC | DETAILS |
| Market Size Available | 2024 to 2033 |
| Base Year | 2024 |
| Forecast Period | 2025 to 2033 |
| CAGR | 17.4% |
| Segments Covered | By Component, Deployment Mode, Analytics Type, Data Source, Application, End-User, and Region |
|
Various Analyses Covered | Global, Regional & Country Level Analysis, Segment-Level Analysis, DROC, PESTLE Analysis, Porter’s Five Forces Analysis, Competitive Landscape, Analyst Overview on Investment Opportunities |
| Regions Covered | North America, Europe, APAC, Latin America, Middle East & Africa |
|
Market Leaders Profiled | IBM Corporation (United States), Google (United States), The Nielsen Company (United Kingdom), Zapr Media Labs (India), Alphonso Inc. (United States), TVSQUARED (Scotland), Amobee, Inc. (United States), 605 (United States), Clarivoy (United States), TVbeat (United Kingdom), BLIX (Australia), H-Tech (Bulgaria), DC Analytics (Germany), SambaTV (United States ), AnalyticOwl (United States), Edgeware AB (USA), Realytics (France), Sorenson Media (USA), FourthWall Media (USA), Parrot Analytics (USA), ISpot. TV (USA), Admo.TV (France), Conviva (USA), iQ Media (USA), BrightLine (United States), and Others. |
REGIONAL ANALYSIS
North America accounted for a leading portion of the global market and is foreseen to continue its reign over the forecast period. Increased investment in original content development by streaming companies is expected to trigger growth in the industry in the coming years. Furthermore, the original content requirement has led telecommunication service providers to integrate appropriate digital content into their service offerings. The rising demand for monetizing content has improved the adoption of analytics in creating advertising content.
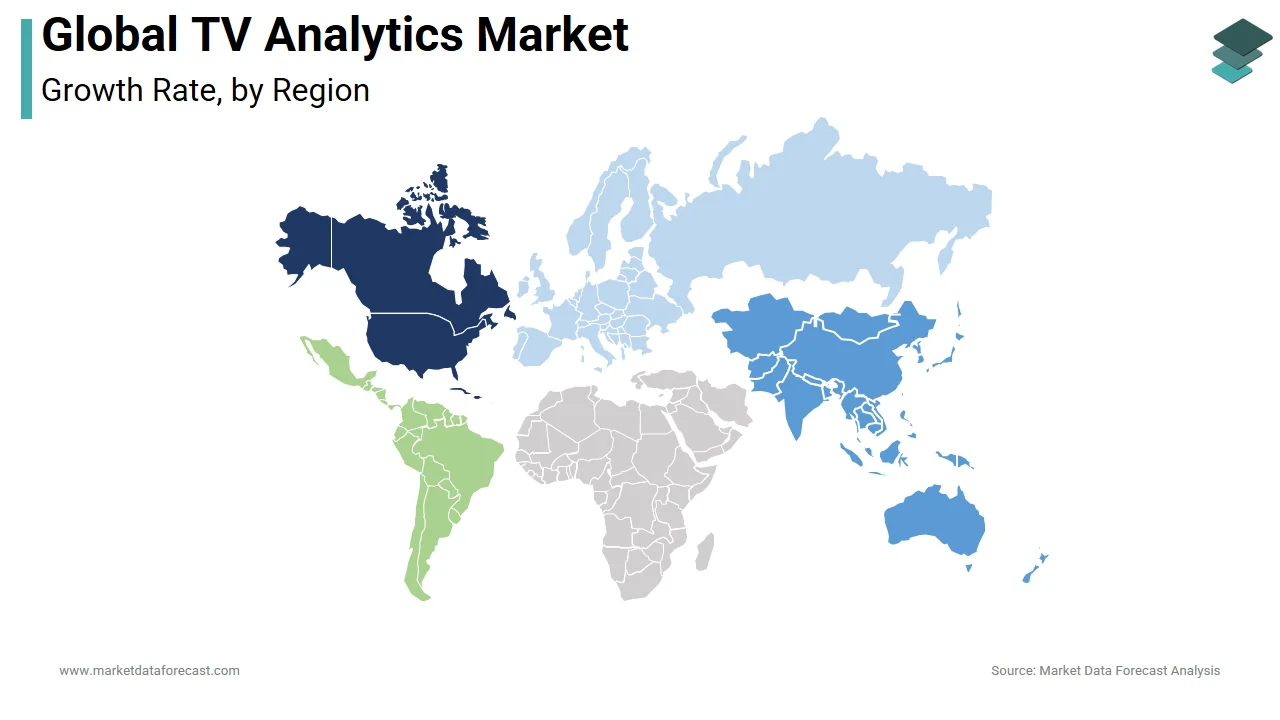
The European market is likely to grow rapidly due to a significant shift from a massive audience to an individual audience. The solution offers consumers the option of choosing content with advertising. Additionally, connected multimedia devices and high-speed broadband networks have helped viewers interact with TV content on multiple devices and platforms.
KEY MARKET PARTICIPANTS
The major companies operating in the global TV analytics market include IBM Corporation (United States), Google (United States), The Nielsen Company (United Kingdom), Zapr Media Labs (India), Alphonso Inc. (United States), TVSQUARED (Scotland), Amobee, Inc. (United States), 605 (United States), Clarivoy (United States), TVbeat (United Kingdom), BLIX (Australia), H-Tech (Bulgaria), DC Analytics (Germany), SambaTV (United States ), AnalyticOwl (United States), Edgeware AB (USA), Realytics (France), Sorenson Media (USA), FourthWall Media (USA), Parrot Analytics (USA), ISpot. TV (USA), Admo.TV (France), Conviva (USA), iQ Media (USA) and BrightLine (United States).
RECENT HAPPENINGS IN THE MARKET
-
In May 2018, 605 launched a new scientific approach, ‘The 605 Impact Index’, which measures the impact of TV advertising campaigns on sales and brand. It would also help marketers develop TV commercial investment strategies.
-
In February 2018, Nielsen launched a new product location measurement tool to compare product locations with the traditional advertising system. Knowledge of the measure will be placed on linear television, SVOD, short video, and subscription video.
-
In November 2017, Google partnered with Salesforce to integrate its Analytics 360 suite into the cloud platform. According to this partnership, Salesforce would offer various benefits to customers and create personalized audiences in Google Analytics 360.
MARKET SEGMENTATION
This research report on the global TV analytics market has been segmented and sub-segmented by components, deployment model, TV transmission type, application, and region.
By Component
- Software
- Services
By Deployment Mode
- On-Premise
- Cloud
By Analytics Type
- Descriptive Analytics
- Predictive Analytics
- Prescriptive Analytics
By Data Source
- Social Media
- Set-Top Boxes (STB)
- Over-the-Top (OTT) Platforms
- Cable TV
- Satellite TV
By Application
- Audience Measurement
- Advertising Effectiveness
- Content Personalization
- Campaign Optimization
- Churn Prediction
By End-User
- Broadcasters
- Advertisers
- Content Providers
- OTT Service Providers
- Cable Operators
By Region
- North America
- Europe
- Asia Pacific
- Latin America
- The Middle East and Africa