- Product Description Description
- Table of Contents TOC
- List of Table & Figure LOT
- Get Free Sample PDF Sample PDF
Market Size, 2025
$474.50 BnMarket Estimate, 2026
$496.80 BnMarket Forecast, 2034
$717.39 BnCAGR, 2026–2034
4.7%U.S. Oil and Gas Market Summary
The U.S. oil and gas market was valued at USD 474.5 billion in 2025 and is projected to reach USD 717.39 billion by 2034, growing at a CAGR of 4.7% from 2026 to 2034, driven by industrial fuel demand, petrochemical expansion, and rising strategic importance of domestic energy security.
Market Snapshot
- 2025 Market Size: USD 474.5 billion
- 2026 Estimate: USD 496.5 billion
- 2034 Forecast: USD 717.39 billion
- CAGR (2026–2034): 4.7%
- Base Year: 2025
- Forecast Period: 2026–2034
The U.S. oil and gas market represents the world’s most technologically advanced and vertically integrated hydrocarbon system, spanning upstream production, midstream logistics, and downstream refining. Dominated by shale-driven output, the U.S. acts as both a domestic energy anchor and a global supply stabilizer, with the Permian Basin and Marcellus Shale forming the backbone of national production.
Quick Growth Drivers
- Sustained industrial and petrochemical demand for natural gas and crude derivatives
- High refinery utilization supporting fuels, lubricants, and specialty chemicals
- U.S. role as a global swing producer during geopolitical disruptions
- Expansion of LNG exports reinforcing upstream and midstream activity
- Technological leadership in hydraulic fracturing and horizontal drilling
Principal Restraints
- Federal and state-level regulatory uncertainty impacting pipeline and terminal approvals
- Lengthy permitting timelines increasing project execution risk
- Rising compliance burden from environmental and methane regulations
- Workforce attrition and loss of legacy operational expertise
High-Value Opportunities
- Carbon Capture and Storage (CCS) retrofits to extend asset lifecycles
- Integration of CCS to meet low-carbon fuel standards
- Blue hydrogen production using existing gas infrastructure
- Repurposing pipelines and storage for hydrogen transport
- LNG-linked infrastructure expansion for Asia-Pacific exports
Key Market Challenges
- Escalating methane emission compliance costs under federal mandates
- Capital access constraints due to ESG-driven divestment
- Declining private equity participation in upstream hydrocarbons
- Talent shortages threatening operational continuity and safety
Fastest-Growing Segments
- Midstream infrastructure – LNG terminals, pipelines, and storage
- Carbon-managed assets – CCS-enabled gas processing facilities
- Hydrogen-ready infrastructure leveraging legacy pipelines
Regional Leadership & Dynamics
- Texas – Dominates U.S. production with 43.1% market share, anchored by the Permian Basin
- Pennsylvania – Marcellus Shale natural gas leadership
- New Mexico & North Dakota – Supporting shale growth
- Gulf Coast – Refining, petrochemical, and LNG export hub
What Wins Commercially
- Low-cost shale production with rapid capital payback
- Integrated upstream–midstream–downstream asset control
- Digital optimization, automation, and predictive maintenance
- Carbon management integration without greenfield risk
- Long-term LNG offtake agreements with global buyers
Top Strategic Ask for Executives
Prioritize capital discipline while integrating carbon capture and hydrogen pathways into existing assets to protect cash flows, maintain investor confidence, and future-proof U.S. oil and gas infrastructure amid tightening regulatory and ESG constraints.
Leading Players
Some of the companies that are playing a dominating role in the U.S. oil and gas market include
ExxonMobil Corporation, Chevron Corporation, ConocoPhillips Company, Marathon Petroleum Corporation, Phillips 66 Company, Energy Transfer L.P., EOG Resources, Inc., Occidental Petroleum Corporation, Devon Energy Corporation, and Hess Corporation.
U.S. Oil and Gas Market Size
The U.S. oil and gas market was valued at USD 474.5 billion in 2025, is expected to reach USD 496.5 billion in 2026, and is projected to be worth USD 717.39 billion by 2034, growing at a CAGR of 4.7% from 2026 to 2034.
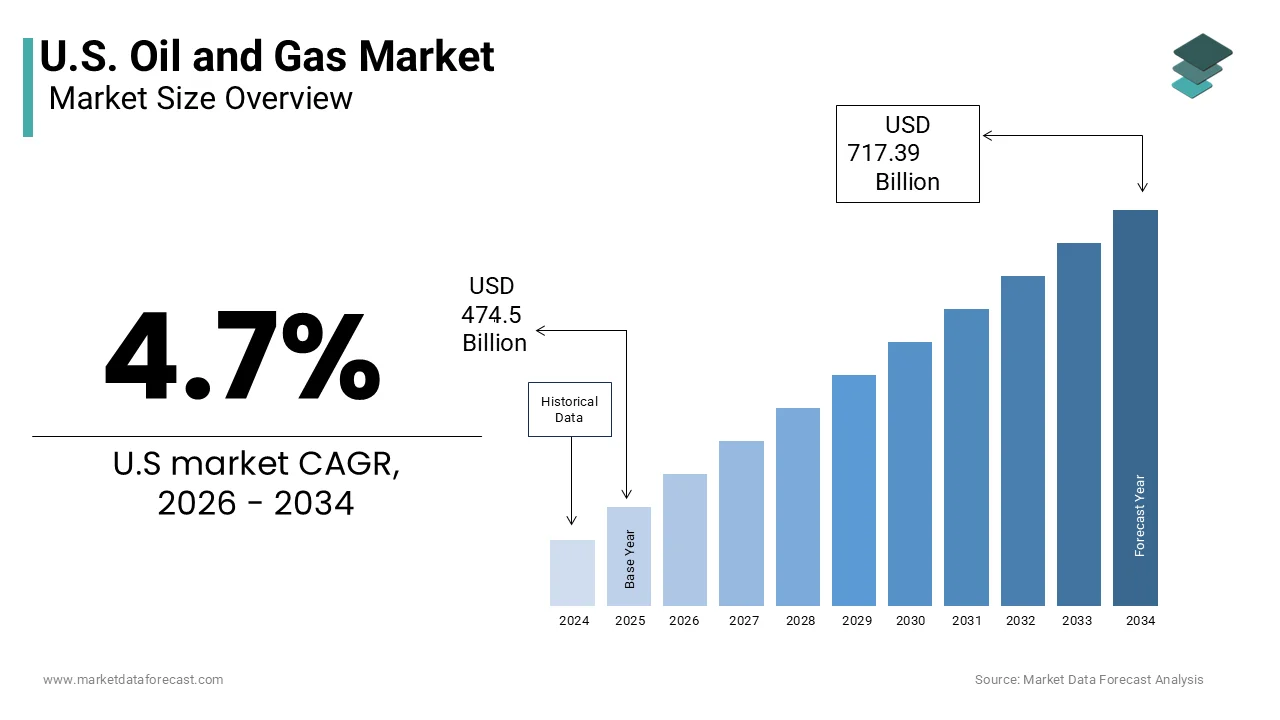
The oil and gas industry is the most voluminous and technologically advanced hydrocarbon production system in the world, characterized by vertically integrated operations spanning exploration, extraction, refining, transportation, and distribution. The Permian Basin alone accounted for over forty-five % of national crude output, while the Marcellus Shale formation supplied more than thirty % of domestic natural gas.
MARKET DRIVERS
Industrial and Petrochemical Demand Anchoring Long-Term Consumption
The expansion of the manufacturing and petrochemical sectors in the US is one of the most important factors for the growth of the US oil and gas market. Natural gas is serving as both feedstock and process heat source, consumed over nine billion cubic feet per day in the sector. Crude oil demand is similarly anchored, with the American Fuel and Petrochemical Manufacturers confirming that U.S. refineries processed over 15 million barrels per day in 2023 to meet domestic and international demand for lubricants, waxes, and specialty chemicals.
Geopolitical Disruptions Reinforcing Domestic Supply Security Imperatives
The global supply chain fragilities and regional conflicts have elevated the strategic value of U.S. oil and gas production as a stabilizing force, which is also elevating the growth of the U.S. oil and gas market. The International Energy Agency acknowledged that U.S. production growth prevented global oil prices from exceeding one hundred and thirty dollars per barrel during the peak of supply uncertainty.
MARKET RESTRAINTS
Regulatory Uncertainty and Permitting Delays Constraining Capital Allocation
The federal and state level regulatory unpredictability is increasingly deterring long-term investment in new oil and gas infrastructure, particularly pipelines and export terminals, which is restraining the growth of the US oil and gas market.
Workforce Attrition and Knowledge Transfer Gaps Threatening Operational Continuity
The rising human capital crisis, as experienced personnel retire without sufficient replacement from younger generations, jeopardizing operational safety and efficiency, is additionally hindering the growth of the US oil and gas market. The gap in legacy knowledge and digital fluency threatens asset integrity, increases maintenance costs, and elevates safety incident risk, hindering the growth of the US oil and gas market.
MARKET OPPORTUNITIES
Carbon Capture and Storage Integration to Extend Asset Lifespans
The integration of carbon capture and storage technologies presents a viable pathway for oil and gas operators to decarbonize operations while preserving core infrastructure and extending field economics, which is one of the new opportunities for the US oil and gas market to grow eventually. The National Petroleum Council confirmed that retrofitting existing gas processing plants with capture technology can reduce emissions intensity by up to 90% by enabling compliance with emerging state-level clean fuel standards.
Hydrogen Co-Production Leveraging Existing Gas Infrastructure
The repurposing of natural gas pipelines and processing facilities for low-carbon hydrogen production and transport offers a capital-efficient transition pathway that preserves midstream asset value, which is also hampering the growth of the US oil and gas market. Pilot projects in Texas and Utah demonstrated that steam methane reforming coupled with carbon capture can produce blue hydrogen at under 2 dollars per kilogram. Kinder Morgan and Energy Transfer are retrofitting compressor stations and storage caverns for dedicated hydrogen service by targeting commercial operations by 2026.
MARKET CHALLENGES
Methane Emission Compliance Costs Escalating Under Federal Mandates
The new federal regulations targeting methane emissions are imposing significant compliance costs and operational modifications on oil and gas producers, particularly small and mid-sized operators, which is degrading the growth of the US oil and gas market.
Capital Market Pressures and ESG Divestment: Reducing Funding Access
The institutional investors and commercial banks are increasingly restricting financing for oil and gas projects based on environmental, social, and governance criteria, which is inhibiting the growth of the US oil and gas market. Private equity, which was once a major funding source, has redirected over 60 billion dollars toward renewable and carbon capture ventures since 2020.
REPORT COVERAGE
| REPORT METRIC | DETAILS |
| Market Size Available | 2025 to 2034 |
| Base Year | 2025 |
| Forecast Period | 2026 to 2034 |
| Segments Covered | By Sector and Region. |
| Various Analyses Covered | Global, Regional, and Country-Level Analysis, Segment-Level Analysis, Drivers, Restraints, Opportunities, Challenges; PESTLE Analysis; Porter’s Five Forces Analysis, Competitive Landscape, Analyst Overview of Investment Opportunities |
| Countries Covered | New York, Massachusetts, Pennsylvania, Illinois, Ohio, Michigan, Texas, Florida, Georgia, California, Washington, Colorado. |
| Market Leaders Profiled | ExxonMobil Corporation, Chevron Corporation, ConocoPhillips Company, Marathon Petroleum Corporation, Phillips 66 Company, Energy Transfer L.P., EOG Resources, Inc., Occidental Petroleum Corporation, Devon Energy Corporation, Hess Corporation |
SEGMENTAL ANALYSIS
By Sector Insights
The upstream sector dominated the United States oil and gas market by occupying 58.5% of the share in 2025 with the nation’s unparalleled production volumes, technological supremacy in hydraulic fracturing, and control over globally pivotal basins such as the Permian, Eagle Ford, and Bakken.
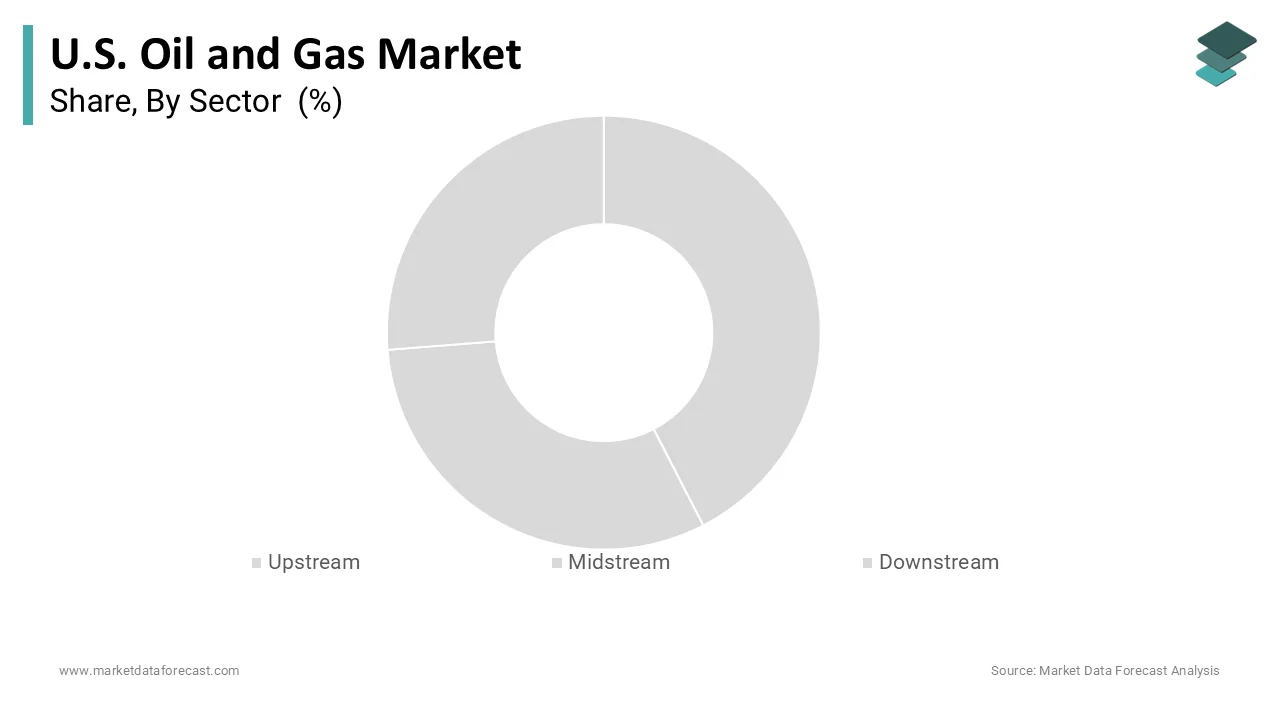
The midstream sector is likely to grow with an expected CAGR of 6.8% from 2025 to 203,3, with the urgent need to alleviate regional bottlenecks, accommodate rising production volumes, and facilitate export growth. Liquefied natural gas export capacity is projected to double by 20,27, with parallel investments in cryogenic storage and marine loading infrastructure thin theS. This structural growth is further reinforced by carbon capture and hydrogen blending initiatives that repurpose existing pipelines, which are creating new revenue streams without greenfield risk.
COUNTRY LEVEL ANALYSIS
Texas Oil And Gas Market Analysis
Texas was the largest contributor to the US oil and gas market with 43.1% of the US oil and gas market share in 2024. Infrastructure density further entrenches dominance with over 85000 miles of pipelines crisscrossing the state, as per the Texas Pipeline Association,n by connecting wellheads to Gulf Coast refineries and export terminals.
COMPETITIVE LANDSCAPE
Competition in the US oil and gas market is intense and shaped by technological innovation, regulatory pressure, and global demand shifts. Major players continuously adapt to maintain operational excellence and cost dominance, while smaller firms focus on niche basins or specialized services. The market rewards efficiency,cy sle and adaptability with firms investing heavily in digital tools, automation, nd data analytics to optimize production and reduce environmental impact. Geopolitical dynamics and the Asia Pacific demand heavily influence export strategies and infrastructure investments. Companies increasingly align with sustainability goals to meet investor and consumer expectations while securing social licenses to operate. Collaboration with international partners and governments helps navigate complex trade environments and secure long-term contracts. Price volatility and regulatory uncertainty require agile decision-making and risk management.
KEY MARKET PLAYERS
Some of the companies that are playing a dominating role in the U.S. oil and gas market include
- ExxonMobil Corporation
- Chevron Corporation
- ConocoPhillips Company
- Marathon Petroleum Corporation
- Phillips 66 Company
- Energy Transfer L.P.
- EOG Resources, Inc.
- Occidental Petroleum Corporation
- Devon Energy Corporation
- Hess Corporation
TOP LEADING PLAYERS IN THE MARKET
- ExxonMobil is a dominant force in the US oil and gas market with extensive upstream and downstream operations. The company has invested heavily in expanding its liquefied natural gas capabilities to serve growing demand in the Asia Pacific region. Recent actions include signing long-term supply agreements with major Asian utilities and advancing low-carbon initiatives to align with regional sustainability goals. ExxonMobil has also increased its presence in emerging countries through joint ventures and infrastructure partnerships. These moves reinforce its global supply chain and ensure reliable energy delivery.
- Chevron operates major oil and gas assets across the United States and maintains a strategic focus on Asia Pacific markets. It has deepened relationships with key buyers in Japan, South Korea, and India through flexible supply contracts and equity partnerships in regional projects. Chevron recently launched new exploration initiatives in offshore basins and upgraded its refining capacity to meet cleaner fuel standards. The company also expanded its renewable fuels division to complement traditional energy offerings.
- ConocoPhillips holds a strong position in the US oil and gas market through its focus on unconventional resources and disciplined capital allocation. The company actively participates in the Asia Pacific region by supplying crude and LNG to refiners and utilities under multi-year contracts. Recent actions include optimizing its Alaska operations for Arctic export potential and deploying advanced analytics to improve reservoir performance. ConocoPhillips has also entered into carbon management agreements with Asian partners to support decarbonization efforts.
TOP STRATEGIES USED BY THE KEY MARKET PARTICIPANTS
Key players in the US oil and gas market focus on operational efficiency through digital transformation and automation to reduce costs and improve safety. They pursue strategic acquisitions and divestitures to optimize asset portfolios and enter high-growth regions. Companies invest heavily in research and development to advance extraction technologies and lower emissions. Partnerships with governments and local firms in the Asia Pacific help secure long-term supply agreements and navigate regulatory environments. Emphasis on environmental, social, and governance goals strengthens brand reputation and attracts investment. Vertical integration across upstream, midstream, and downstream activities ensures supply chain control.
MARKET SEGMENTATION
This research report on the U.S. oil and gas market is segmented and sub-segmented into the following categories.
By Sector
- Upstream
- Midstream
- Downstream
By Country
- Texas
- North Dakota
- Alaska
- New Mexico
- California
- Rest of the United States