- Product Description Description
- Table of Contents TOC
- List of Table & Figure LOT
- Get Free Sample PDF Sample PDF
Market Size, 2025
$78.36 BnMarket Estimate, 2026
$85.37 BnMarket Forecast, 2034
$169.49 BnCAGR, 2026–2034
8.95%U.S. Renewable Energy Market Summary
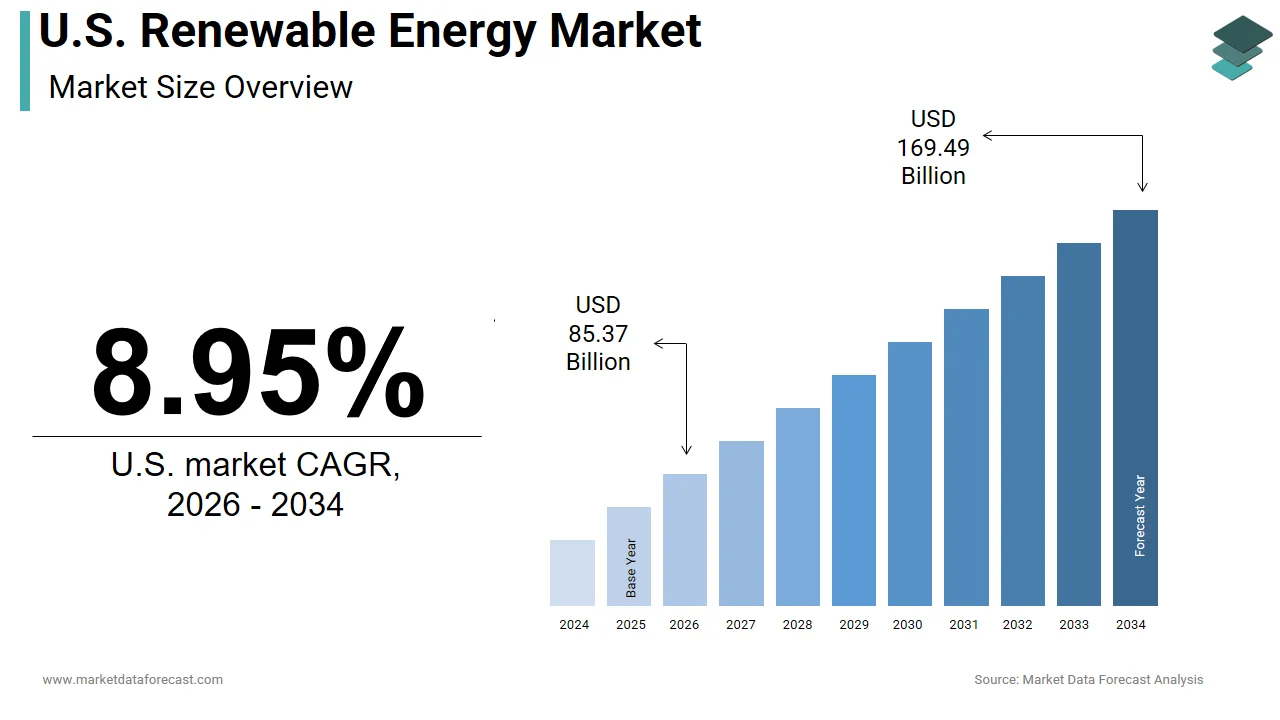
The U.S. renewable energy market was valued at USD 78.36 billion in 2025 and is projected to reach USD 85.37 billion in 2026. By 2034, the market is expected to reach USD 169.49 billion, growing at a CAGR of 8.95% from 2026 to 2034. Growth is driven by strong federal incentives under the Inflation Reduction Act, rising corporate clean energy procurement, falling wind and solar costs, and ambitious state-level renewable energy mandates.
Key Market Numbers
- 2025 Market Size: USD 78.36 billion
- 2026 Estimate: USD 85.37 billion
- 2034 Forecast: USD 169.49 billion
- CAGR (2026 to 2034): 8.95%
- Installed Renewable Capacity: 320+ GW
- Homes Powered by Renewables: 240+ million
- Federal Incentives Unlocked: USD 370+ billion
Segment Insights
- Largest Segment (2025): Wind Energy — 42.3% share
- Fastest-Growing Segment: Solar Energy — CAGR 18.7%
- Wind Capacity: Solar Growth: 147+ GW installed
- >50% of new U.S. power capacity in 2023
Regional Insights
- California leads with a 54.6% share, supported by 100% clean electricity targets and strong solar + storage deployment.
- Texas follows with a 33.4% share, backed by abundant wind and solar resources and strong corporate PPA activity.
Key Growth Drivers
- Inflation Reduction Act (IRA) tax credits and bonus incentives
- Corporate procurement exceeding 37 GW in 2023
- Declining LCOE for wind and solar
- Federal and state renewable mandates
- Rapid expansion of grid-scale storage
- Increasing institutional capital investment
Major Restraints
- Transmission congestion and long interconnection queues
- Workforce shortages across renewable construction and operations
- Local permitting delays and regulatory fragmentation
Emerging Opportunities
- Repowering aging wind and solar assets for 40–50% higher output
- Green hydrogen development (DOE Hydrogen Shot, $1/kg goal)
- Rapid offshore wind expansion on both U.S. coasts
- Grid modernization and smart inverter deployment
Top Companies
- NextEra Energy Resources
- Vestas
- Orsted US Offshore Wind
- Siemens Gamesa
- First Solar
- Invenergy
- Sunrun
- GE
U.S. Renewable Energy Market Size
The U.S. renewable energy market size was USD 78.36 billion in 2025, is anticipated to be USD 85.37 billion in 2026, and is projected to reach USD 169.49 billion by 2034, registering a CAGR of 8.95% from 2026 to 2034.
The renewable energy with the generation, distribution, and integration of electricity derived from naturally replenishing sources, including wind, solar, hydroelectric, geothermal, and biomass. Installed renewable capacity now exceeds three hundred and twenty gigawatts, sufficient to power over two hundred and forty million average American homes. Federal policy shifts the Inflation Reduction Act that has unlocked over three hundred and seventy billion dollars in direct incentives, accelerating deployment timelines, and attracting institutional capital.
MARKET DRIVERS
Federal Climate Legislation Unlocking Unprecedented Capital Deployment
They fundamentally altered the investment calculus for renewable energy developers by extending and expanding tax credits across technologies, which is driving the growth of the United States renewable energy market. Developers now benefit from transferability provisions allowing tax credits to be sold to third parties, which is unlocking capital for entities with limited tax appetite. Additionally, the Environmental Protection Agency allocated over five billion dollars to states for renewable integration under the Greenhouse Gas Reduction Fund, targeting disadvantaged communities. These mechanisms collectively reduce project risk, compress payback periods, and attract institutional investors managing over forty trillion dollars in global assets as per the Principles for Responsible Investment.
Corporate Procurement Mandates Accelerating Offtake Commitments
The large corporations are driving renewable energy growth through long-term power purchase agreements motivated by environmental, social, and governance commitments and cost predictability, which is propelling the growth of the United States renewable energy market. According to the Clean Energy Buyers Association, corporate buyers contracted over 37 gigawatts of new renewable capacity in 2023, a forty two% increase from the prior year. Technology and manufacturing firms, including Google, Microsoft, and General Motors, accounted for over 60% of this volume, seeking to meet 100% renewable energy targets by 2030 as verified by RE100. These agreements provide developers with bankable revenue streams, enabling project financing even in the absence of utility offtake.
MARKET RESTRAINTS
Transmission Infrastructure Deficits Constraining Interconnection
The existing high voltage transmission network was engineered for centralized fossil fuel generation and lacks the spatial flexibility and capacity required to integrate geographically dispersed renewable resources. The transmission infrastructure deficits are solely restricting the growth of the United States renewable energy market. According to the North American Electric Reliability Corporation, over 1,500 gigawatts of generation capacity, primarily wind and solar, remain stuck in interconnection queues as of early 2024, exceeding the nation’s entire operational generation fleet. The Federal Energy Regulatory Commission acknowledged that the median interconnection study duration for new projects now exceeds 28 months by causing developers to incur carrying costs of up to one point two million dollars per month.
MARKET OPPORTUNITIES
Repowering Aging Wind and Solar Assets to Unlock Higher Yields and Extend Project Lifespans
The systematic repowering of legacy renewable energy installations presents a substantial opportunity to enhance output without expanding land use or triggering new permitting cycles, which creates new opportunities for the growth of the United States renewable energy market. According to the U.S. Department of Energy, over 15 gigawatts of wind capacity installed before 2024 are now eligible for turbine replacement, with newer models offering up to 40% greater annual energy production due to taller hub heights and advanced blade aerodynamics. The Lawrence Berkeley National Laboratory documented that repowering projects in states like Iowa and Texas have achieved capacity factor improvements from 32% to 51%, effectively doubling output per acre. The Internal Revenue Service permits repowered projects to qualify for new investment tax credits if at least 80% of the facility’s value is replaced by creating powerful financial incentives.
Green Hydrogen Integration to Decarbonize Hard-to-Electrify Sectors
The coupling of renewable energy with electrolytic hydrogen production opens a transformative pathway to decarbonize industrial processes, heavy transport, and long-duration energy storage. According to the U.S. Department of Energy’s Hydrogen Shot initiative, the goal is to reduce clean hydrogen production costs to one dollar per kilogram within a decade, making it competitive with fossil-derived hydrogen, currently priced at 2.5 dollars per kilogram. The Department allocated seven billion dollars in 2023 to establish seven regional clean hydrogen hubs, which are targeting sectors such as steelmaking, ammonia production, and long-haul trucking. Renewable-powered electrolyzers deployed in Texas and California are already producing hydrogen at under three dollars per kilogram, with pilot projects demonstrating round-trip efficiency exceeding sixty percent when paired with fuel cells. The Inflation Reduction Act provides a three-dollar per kilogram production tax credit for hydrogen generated with less than zero point four five kilograms of CO2 per kilogram of H2, effectively subsidizing renewable-based production. This symbiosis not only creates new offtake markets for excess renewable generation but also enables deep decarbonization where direct electrification remains technologically or economically unfeasible.
MARKET CHALLENGES
Skilled Labor Shortages Threatening Project Timelines and Cost Competitiveness
The renewable energy sector’s rapid expansion has outpaced the development of a sufficiently trained and geographically distributed workforce, which may slightly hamper the growth of the United States renewable energy market. According to the Interstate Renewable Energy Council, the United States must add skilled workers by 2030 to meet projected installation targets, yet current vocational pipelines graduate fewer than 55,000 annually. Rural deployment zones face the most severe deficits; the Appalachian Regional Commission found that workforce density in renewable trades remains less than twenty percent of national averages despite abundant resource potential.
Regulatory Fragmentation and Siting Conflicts Delaying Critical Infrastructure
The absence of federal preemption over local land use and environmental permitting approval process that varies dramatically across jurisdictions introduces multi-year delays and cost overruns for renewable and transmission projects. These regulatory fragmentation and siting conflicts are delaying infrastructure are limiting the growth of the United States renewable energy market. The median time to secure local permits for utility-scale solar or wind projects exceeds twenty months in over 70% of counties, with some California and Northeastern jurisdictions requiring more than 36 months. Local opposition, often citing visual impact or wildlife concerns, has halted or downsized over twelve gigawatts of proposed projects since 2020, as per the Sabin Center for Climate Change Law. The National Environmental Policy Act review process, while essential, lacks standardized timelines, with environmental impact statements averaging four point five years for large projects, according to the White House Council on Environmental Quality.
REPORT COVERAGE
| REPORT METRIC | DETAILS |
| Market Size Available | 2025 to 2034 |
| Base Year | 2025 |
| Forecast Period | 2026 to 2034 |
| Segments Covered | By Technology, End-user, and County. |
| Various Analyses Covered | Global, Regional and Country-Level Analysis, Segment-Level Analysis, Drivers, Restraints, Opportunities, Challenges; PESTLE Analysis; Porter’s Five Forces Analysis, Competitive Landscape, Analyst Overview of Investment Opportunities |
| Countries Covered | New York, Massachusetts, Pennsylvania, Illinois, Ohio, Michigan, Texas, Florida, Georgia, California, Washington, Colorado. |
| Market Leaders Profiled | Vestas Wind Systems A/S, NextEra Energy Resources, Orsted US Offshore Wind, Siemens Gamesa Renewable Energy S.A., First Solar Inc., Invenergy, Sunrun Inc., General Electric Company, and Others. |
SEGMENTAL ANALYSIS
By Technology Insights
The wind energy segment was the largest by accounting for 42.3% of the United States renewable energy market share in 2024 from vast onshore wind resources concentrated in the Great Plains and Midwest, combined with technological maturation that has driven down the levelized cost of electricity to as low as 26 dollars per megawatt hour for new projects as reported by Lazard in two thousand and twenty three. As per the American Wind Energy Association, installed wind capacity surpassed one hundred and forty-seven gigawatts by early 2024, capable of powering over 45 million American homes. Federal production tax credits, extended under the Inflation Reduction Act, continue to incentivize development in states like Texas, Iowa, and Oklahoma, which collectively host over 50% of national capacity. Grid operators such as the Midcontinent Independent System Operator have integrated advanced forecasting tools that reduce curtailment to under two percent, enhancing dispatch reliability.
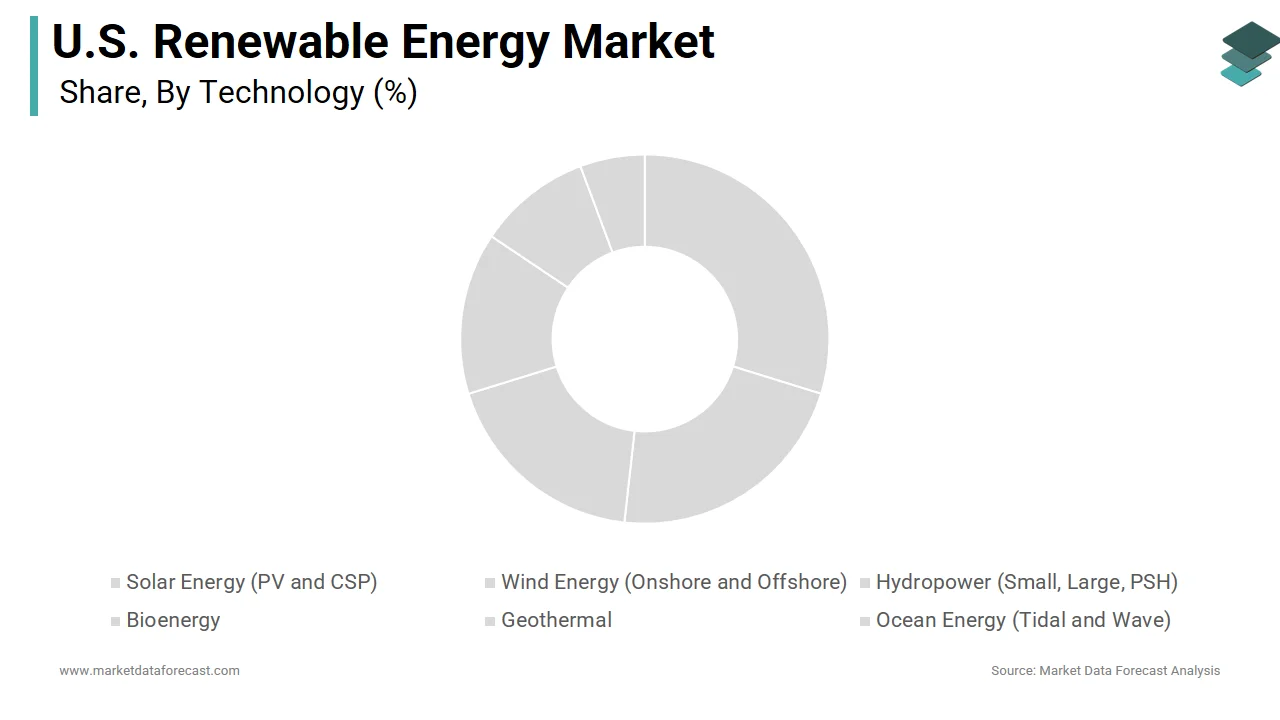
The solar energy segment is expected to grow at the fastest CAGR of 18.7% during the forecast period, with the plummeting hardware costs, policy tailwinds, and distributed deployment models that circumvent traditional utility gatekeeping. As per the Solar Energy Industries Association, new solar capacity added in 2023 represented more than half of all new electricity-generating capacity installed nationwide. Residential adoption is surging due to federal tax credits and state-level net metering. Corporate and municipal procurement is equally transformative, where the Clean Energy Buyers Association confirmed that non-utility entities signed power purchase agreements for over twelve gigawatts of solar in 2023. Grid integration innovations, including smart inverters and distributed energy resource management systems, are enabling higher penetration without destabilizing frequency or voltage, removing a critical barrier to scalability.
REGIONAL ANALYSIS
California Renewable Energy Market Analysis
California was the top performer in the United States renewable energy market by capturing 54.6% of share in 2024 through legally binding mandates, including Senate Bill 100, which requires 100% carbon-free electricity by 2045. Wind and solar together contributed over 85% of the state’s renewable mix, supported by over seven gigawatts of grid-scale battery storage, as documented by the California Public Utilities Commission. The state’s Self Generation Incentive Program has disbursed over one point four billion dollars since 2002 to support distributed solar plus storage adoption, particularly in low-income and fire-prone communities.
Texas Renewable Energy Market Analysis
Texas renewable energy market held 33.4% of the share in 2024, with abundant natural resources, market-oriented regulatory structures, and minimal permitting barriers. Competitive energy pricing, averaging thirty-nine dollars per megawatt hour for new wind and solar contracts, attracts corporate buyers and merchant developers alike. The state’s Competitive Renewable Energy Zones initiative has unlocked transmission capacity for over 20 gigawatts of new projects since fifteen, alleviating congestion in West Texas. Corporate data centers in North Texas are signing direct power purchase agreements exceeding two gigawatts annually.
COMPETITIVE LANDSCAPE
The United States renewable energy market features a multi-tiered competitive landscape where vertically integrated utilities, independent power producers, and global developers vie for project rights, interconnection capacity, and corporate offtake agreements. Competition intensifies around access to transmission-constrained regions and federal incentive bonus zones such as energy communities and low-income areas. Technological differentiation in hybrid plant design and digital grid integration serves as a key battleground for securing premium power purchase agreements. Labor availability and supply chain localization have become decisive factors in project execution speed and cost control. Customer acquisition costs remain elevated in distributed solar, prompting consolidation among regional installers. Corporate procurement demands are reshaping contract structures and forcing innovation in merchant risk management. Regulatory lobbying and policy advocacy are now core competencies as federal and state incentives evolve. Market leaders increasingly compete on sustainability credentials, including biodiversity protection, workforce equity, and circular economy initiatives for end-of-life asset recovery.
KEY MARKET PLAYERS
Some of the companies that are playing a dominating role in the U.S. renewable energy market include
- Vestas Wind Systems A/S
- NextEra Energy Resources
- Orsted US Offshore Wind
- Siemens Gamesa Renewable Energy S.A.
- First Solar Inc.
- Invenergy
- Sunrun Inc.
- General Electric Company
TOP PLAYERS IN THE MARKET
- NextEra Energy Resources develops and operates some of the largest wind and solar projects across the United States and has expanded its technical advisory services into Australia and Japan. The company collaborates with Asia Pacific utilities to optimize hybrid renewable plus storage dispatch using its proprietary grid integration software. NextEra signed a joint development agreement with a South Korean conglomerate to co-design offshore wind projects. It also deployed its performance analytics platform to monitor solar farms in India. These initiatives reflect its export of operational excellence and digital innovation to support international decarbonization while reinforcing its domestic leadership through global knowledge transfer.
- Orsted US Offshore Wind leads the development of East Coast offshore wind projects and has transferred its European marine expertise to Taiwan and Japan. The company partnered with Japanese shipbuilders to localize foundation manufacturing and trained Taiwanese technicians in offshore installation protocols. Orsted launched a floating wind pilot with a Korean research institute to adapt technology for deep-water sites. It also advised Philippine regulators on seabed leasing frameworks. These actions demonstrate strategic capacity building and policy shaping abroad, which in turn strengthen its U.S. credibility as a global offshore leader and enhance its ability to navigate complex marine permitting environments domestically.
- Invenergy develops utility-scale wind, solar, and storage projects across North America and has extended its project finance and development model to Australia and Japan. The company structured Asia Pacific’s first merchant renewable plus storage project in Queensland, applying U.S. market design principles. Invenergy partnered with a Japanese trading house to co-invest in battery storage systems supporting solar farms. It also launched a digital asset management platform tailored for Southeast Asian operators. These efforts export its integrated development and risk mitigation expertise, reinforcing its U.S. position by validating its models in diverse regulatory and climatic environments while building global investor confidence.
TOP STRATEGIES USED BY KEY MARKET PARTICIPANTS
Leading participants in the United States renewable energy market prioritize securing long-term offtake agreements with corporations and utilities to de-risk project financing. They invest in proprietary digital platforms to optimize asset performance and predictive maintenance. Strategic acquisitions of development pipelines accelerate geographic expansion without greenfield delays. Partnerships with local communities and tribal nations secure social license and streamline permitting. Vertical integration into battery storage and green hydrogen unlocks additional revenue streams. Workforce development through certified apprenticeship programs addresses labor shortages. Lobbying for streamlined federal and state permitting reduces timeline uncertainty. Diversification across wind, solar, and emerging technologies mitigates policy and resource risk. Participation in federal loan guarantee and tax credit programs enhances capital efficiency. Exporting operational models to international markets builds global brand authority and attracts institutional capital.
MARKET SEGMENTATION
This research report on the U.S. renewable energy market has been segmented and sub-segmented into the following categories.
By Technology
- Solar Energy (PV and CSP)
- Wind Energy (Onshore and Offshore)
- Hydropower (Small, Large, PSH)
- Bioenergy
- Geothermal
- Ocean Energy (Tidal and Wave)
By End-User
- Utilities
- Commercial and Industrial
- Residential
By Country
- New York
- Texas
- Florida
- Georgia
- California
- Rest of U.S.