Global Energy Drinks Market Size, Share, Trends & Growth Forecast Report By Type (Isotonic, Hypotonic & Hypertonic), Ingredient Type, Packaging, Region, and Industry Analysis (2026 to 2034)
Market Size, 2025
$84.03 BnMarket Estimate, 2026
$90.33 BnMarket Forecast, 2034
$161.10 BnCAGR, 2026–2034
7.5%Global Energy Drinks Market Report Summary
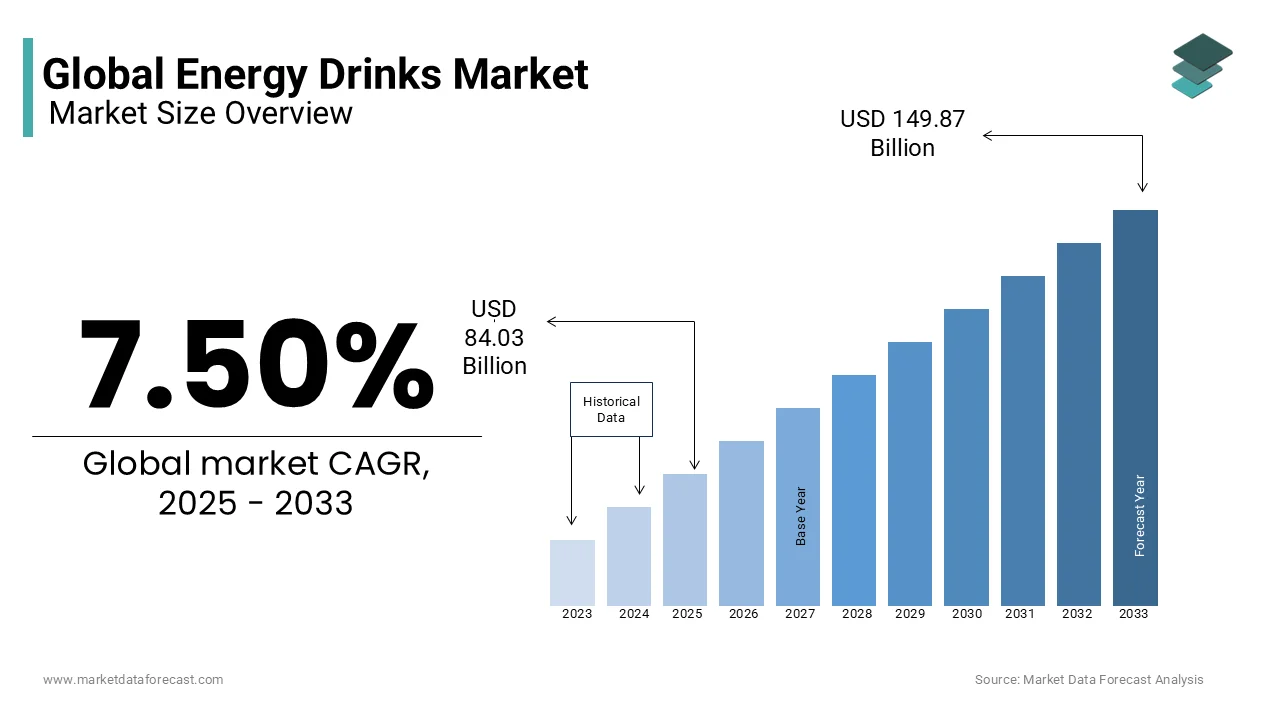
The global energy drinks market size was valued at USD 84.03 billion in 2025, is projected to reach USD 90.33 billion in 2026, and is expected to climb to USD 161.10 billion by 2034, growing at a solid CAGR of 7.50% from 2026 to 2034. Growth is driven by rising demand for functional beverages, increasing consumption of caffeinated drinks for alertness and performance, and expanding popularity among fitness enthusiasts and young adults. Strong marketing campaigns, innovative flavor launches, and expanded retail penetration across convenience stores, supermarkets, and online channels continue to fuel global market expansion.
Key Market Trends
- Increasing adoption of energy drinks for enhanced alertness, endurance, and mental focus.
- Rising popularity of sugar-free, natural, and functional energy drink formulations.
- Strong brand positioning through aggressive marketing, sponsorships, and sports collaborations.
- Growth of ready-to-drink functional beverages appealing to active lifestyles.
- Expanding retail presence across supermarkets, convenience stores, gyms, and e-commerce platforms.
- Increasing consumption among working professionals and fitness-driven consumers.
Segmental Insights
- Based on type, the non-alcoholic segment held a significant share of the global energy drinks market in 2025, driven by high consumer preference for safe, daily-use energy beverages with fewer regulatory restrictions.
- Based on packaging, the cans segment captured a prominent share of the market in 2025 due to their portability, convenience, longer shelf life, and strong alignment with energy drink branding.
- Based on end user, the adults aged 25 - 44 segment dominated the global market in 2025, accounting for 58.4% of total consumption owing to high demand among working professionals and fitness-oriented consumers.
Regional Insights
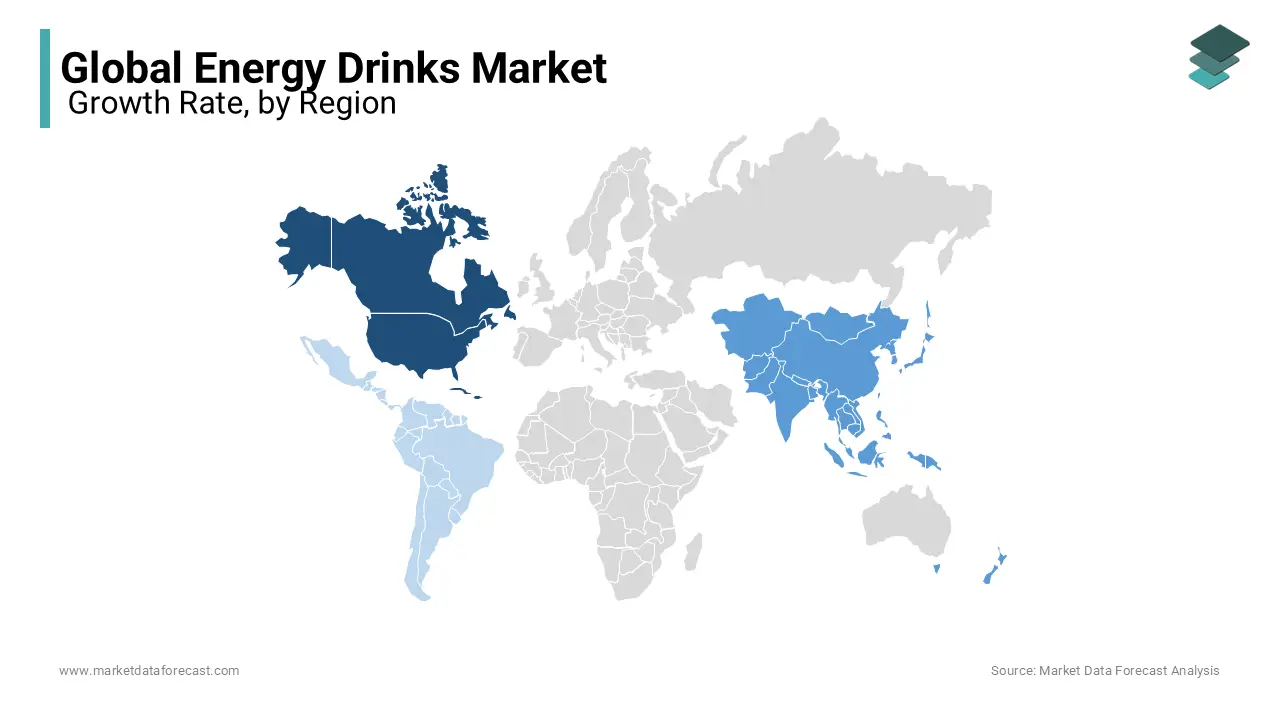
- North America led the global energy drinks market with 34.2% share in 2025, supported by strong brand loyalty, high consumption rates among young adults, and continuous product innovation across the United States and Canada.
Competitive Landscape
The global energy drinks market is highly competitive, driven by strong branding, product innovation, and aggressive marketing strategies. Companies are focusing on expanding product lines, launching natural and zero-sugar variants, and strengthening global distribution networks. Major companies dominating the global energy drinks market include Red Bull, Taisho Pharmaceutical Co. Ltd., PepsiCo Inc., Monster Energy, Lucozade, The Coca-Cola Company, Amway, AriZona Beverages USA, Living Essentials LLC, and Xyience Energy
Global Energy Drinks Market Size
The global energy drinks market size was valued at USD 84.03 billion in 2025, and the global market size is expected to reach USD 161.10 billion by 2034 from USD 90.33 billion in 2026. The market's promising CAGR for the predicted period is 7.50%.
The energy drinks products are distinct from traditional soft drinks due to their functional claims, targeting consumers seeking immediate cognitive or physical boosts. As per Euromonitor International, energy drinks are increasingly positioned within the broader category of functional beverages, reflecting a shift toward performance-oriented consumption. Regulatory frameworks vary significantly across regions, influencing ingredient inclusion and marketing claims. For instance, the European Food Safety Authority has established a safe daily intake level of 400 mg of caffeine for healthy adults, shaping product development in compliant markets.
MARKET DRIVERS
Rising Participation in High-Intensity Sports and Fitness Activities
The global surge in engagement with high-intensity training, endurance sports, and gym-based fitness regimes is fuelling the growth of the energy drinks market. According to the International Health, Racquet & Sportsclub Association, over 180 million people were health club members worldwide in 2022, with North America and Asia-Pacific witnessing the fastest growth in functional beverage consumption among active individuals. Energy drinks are increasingly consumed pre- or intra-workout due to their ability to delay fatigue and improve concentration. A study published in the Journal of the International Society of Sports Nutrition demonstrated that caffeine ingestion at doses of 3–6 mg per kg of body weight enhanced endurance performance by up to 12% in trained athletes. Moreover, Red Bull, one of the market leaders, sponsors over 200 extreme sports events annually by including cliff diving and air racing, reinforcing brand association with physical exertion.
Expanding Night-Time Economy and Shift-Based Workforces
The proliferation of 24-hour economies and the growth of shift-based employment across transportation, healthcare, and digital services is additionally to level up the growth of the energy drinks market. As per the International Labour Organization, approximately 22% of the global workforce equivalent to over 600 million workers engages in non-standard working hours, including night shifts and rotating schedules. These workers frequently turn to energy drinks to sustain cognitive performance during nocturnal hours. Energy drink sales in convenience stores located near transport hubs like Heathrow Airport and King’s Cross Station increased by 18% between 2021 and 2023, as per Kantar Worldpanel.
MARKET RESTRAINTS
Increasing Regulatory Scrutiny on Caffeine Content and Health Claims
The governments worldwide are intensifying regulatory oversight on energy drink formulations, which is restricting the growth of the energy drinks market. As per the European Food Safety Authority, acute caffeine intake above 200 mg per single dose may pose health risks, especially for adolescents and individuals with cardiovascular conditions by prompting several nations to impose labeling mandates or sales restrictions. These incidents have spurred legislative actions; for instance, the California State Assembly introduced Bill AB-229 in 2023 to restrict sales to minors under 18. According to the World Health Organization, 28 countries in the Eastern Mediterranean and Southeast Asia regions implemented partial or full bans on energy drink advertising targeting youth.
Mounting Public Health Concerns Over Sugar Content and Metabolic Risks
The high sugar load in conventional energy drinks has triggered widespread public health criticism, linking consumption to obesity, type 2 diabetes, and dental erosion, thereby dampening consumer confidence and inviting policy-level interventions. This has prompted the government to enforce front-of-package warning labels on high-sugar beverages, resulting in a 14% decline in energy drink sales volume between 2020 and 2022.
MARKET OPPORTUNITIES
Expansion of Natural and Organic Energy Drink Formulations
The growing consumer preference for clean-label, plant-based, and naturally sourced ingredients is escalating the growth of the energy drinks market. As per the Organic Trade Association, global sales of organic beverages grew at a compound annual rate of 9.3% between 2019 and 2023, with North America and Western Europe leading adoption. Consumers are increasingly scrutinizing ingredient lists, which is favoring stimulants like green tea extract, guarana, and yerba mate over synthetic caffeine. According to a 2023 survey by the Hartman Group, 68% of U.S. consumers expressed willingness to pay a premium for energy drinks with recognizable, natural ingredients. Brands such as Runa and Guayaki have capitalized on this trend, utilizing Amazonian botanicals to deliver sustained energy without artificial additives. Startups like Emerge and Toro Matcha are gaining traction by combining adaptogens and botanical caffeine with functional benefits such as stress reduction and mental clarity. This shift aligns with broader dietary movements toward holistic wellness by enabling differentiation in a saturated market.
Penetration into Underserved Rural and Semi-Urban Markets
The gradual expansion of distribution networks and rising disposable incomes in rural and semi-urban regions of emerging economies is expanding the growth of the energy drinks market. This economic uplift, combined with improved road infrastructure and cold chain logistics, has enabled beverage companies to extend reach beyond metropolitan centers. According to the National Development Planning Agency, motorcycle ownership with a key indicator of mobility and access to consumer goods increased by 12 million units between 2020 and 2023 by enhancing last-mile distribution capabilities.
MARKET CHALLENGES
Proliferation of Counterfeit and Unregulated Products in Emerging Markets
The widespread circulation of counterfeit and substandard products with brand integrity and consumer safety is likely to degrade the growth of the energy drinks market. As per the International Trademark Association, Southeast Asia and parts of Africa report counterfeit rates exceeding 20% in the beverage sector, with unlicensed manufacturers replicating packaging of leading brands such as Red Bull and Monster. These illicit products often bypass quality controls, posing severe health risks; a 2023 investigation by the Ghana Food and Drugs Authority found that 31% of sampled counterfeit energy drinks exceeded permissible caffeine limits by up to 300%. The lack of cold storage and regulatory enforcement in remote areas further exacerbates the issue. Legitimate manufacturers incur substantial losses in brand equity and market share, while consumers face confusion and potential harm.
Escalating Environmental Impact of Single-Use Packaging
The dependence on aluminum cans and plastic bottles with the growing environmental degradation and attracting scrutiny from regulators and eco-conscious consumers, which is also to pose a significant challenge for the growth of the energy drinks market. As per the United Nations Environment Programme, the beverage sector accounts for 20% of global plastic waste, with energy drink packaging representing a growing share due to high consumption frequency and portable formats. In 2022, the European Environment Agency reported that only 48% of aluminum beverage cans were recycled across EU member states, leaving millions in landfills or ecosystems annually. In the Philippines, where energy drink consumption is among the highest in Asia, the Department of Environment and Natural Resources identified beverage containers as the second most common item in coastal clean-up drives, following sachet waste.
REPORT COVERAGE
| REPORT METRIC | DETAILS |
| Market Size Available | 2025 to 2034 |
| Base Year | 2025 |
| Forecast Period | 2026 to 2034 |
| CAGR | 7.50% |
| Segments Covered | By Type, Packaging, End-User, and Region |
| Various Analyses Covered | Global, Regional, & Country Level Analysis; Segment-Level Analysis; DROC, PESTLE Analysis; Porter’s Five Forces Analysis; Competitive Landscape, Analyst Overview of Investment Opportunities |
| Regions Covered | North America, Europe, APAC, Latin America, Middle East & Africa |
| Market Leaders Profiled | Red Bull, Monster Beverage Corporation, Rockstar Inc., Coca Cola, Pepsi Co, Arizona Beverage Company, National Beverage Corp., Dr. Pepper Snapple Group, Living Essentials, Cloud 9 |
SEGMENTAL ANALYSIS
By Type Insights
The non-alcoholic segment was accounted in holding a significant share of the energy drinks market share in 2025 with the widespread regulatory acceptance, broader demographic accessibility, and alignment with health and safety norms across both developed and emerging economies. According to the World Health Organization, over 70% of countries impose strict regulations or outright bans on the sale of alcoholic energy drinks due to concerns over increased risk-taking behavior and alcohol dependency among youth.
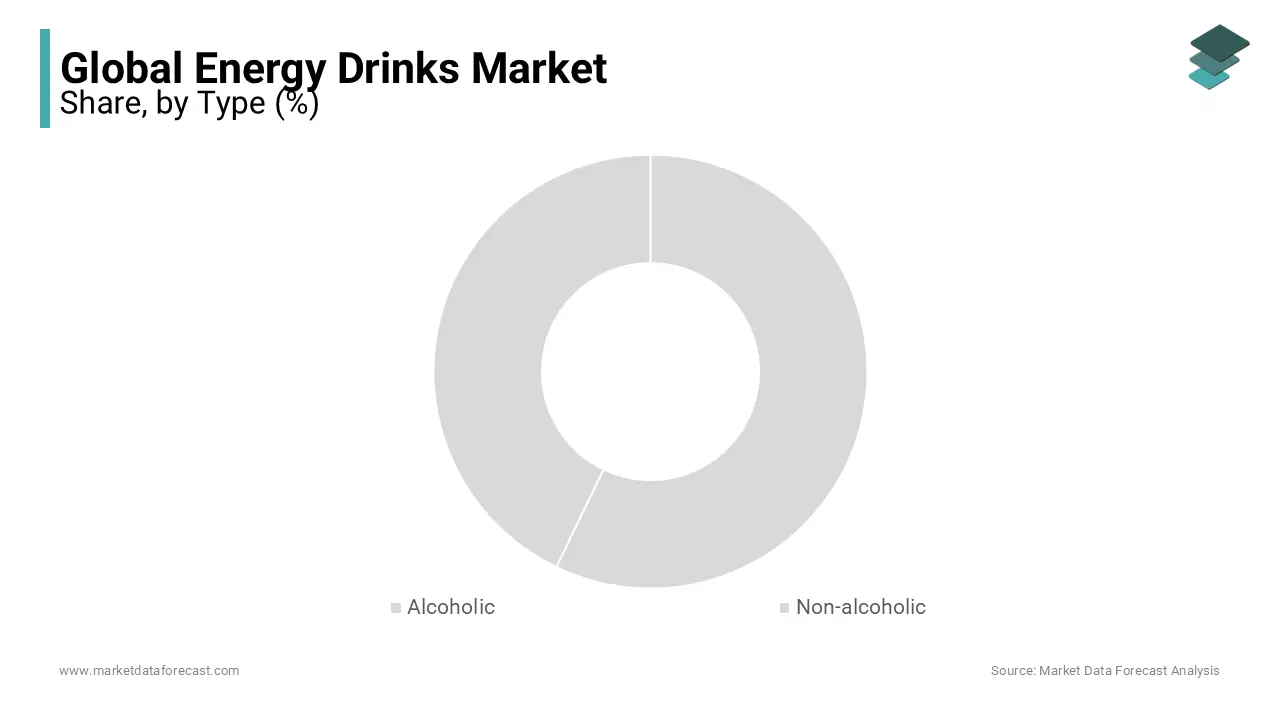
The alcoholic energy drinks segment is expected to grow with an anticipated CAGR of 5.7% in the coming years with social drinking cultures and the rise of ready-to-drink (RTD) hybrid beverages that blend stimulants with low-alcohol formulations. Additionally, product innovation has played a pivotal role; brands like Four Loko and Joose have reformulated their offerings to comply with regulatory standards by reducing caffeine content and eliminating banned stimulants, thereby re-entering previously restricted markets. In South Africa, the introduction of legal, low-caffeine alcoholic energy drinks led to a 14% surge in category sales between 2021 and 2023, according to the South African Liquor Brand Owners Association. Moreover, the expansion of night-time economies in urban centers across Brazil and Poland has created fertile ground for consumption.
By Packaging Insights
The cans segment was the largest by capturing a prominent share of the energy drinks market in 2025 with their functional advantages, including portability, rapid cooling, and compatibility with high-speed distribution networks. According to the Aluminum Association, a standard 250 ml energy drink can weighs only 13 grams, enabling efficient logistics and reduced transportation emissions—factors for large-scale retailers and e-commerce platforms. Additionally, cans offer superior shelf life and protection against light and oxygen degradation, preserving the stability of sensitive ingredients like taurine and B-vitamins.
The bottled segment is likely to grow with a CAGR of 21.4% during the forecast period with the shifting consumer preferences toward larger formats and premium positioning, particularly in health-oriented and functional beverage subcategories. Additionally, bottled formats are increasingly used for premium and functional variants, such as sugar-free, vitamin-enriched, and plant-based energy drinks, which require larger labels for ingredient transparency and health claims. In Australia, the Australian Beverages Council reported that bottled energy drinks accounted for 34% of year-on-year growth in the premium segment in 2023.
By End User Insights
The adults aged 25–44 segment held 58.4% of global energy drink market share in 2025 with the prevalence of long working hours and shift-based employment in sectors such as transportation, healthcare, and information technology. According to the International Labour Organization, 27% of workers globally perform overtime, with rates exceeding 40% in countries like South Korea and Turkey, where energy drink consumption per capita is among the highest.
The teenagers segment (aged 13–19) is swiftly emerging with an expected CAGR of 7.3% during the forecast period with the increasing academic pressure and digital immersion, both of which contribute to sleep deprivation and reliance on stimulants for cognitive performance. According to the Australian Institute of Health and Welfare in 2023, 44% of high school students consumed energy drinks at least once a week, with usage peaking during midterms and finals. Social media influence further amplifies this trend, with influencers and esports personalities normalizing energy drink use among youth.
REGIONAL ANALYSIS
North America Energy Drinks Market Analysis
North America was the top performer in the global energy drinks market with 34.2% of share in 2025 owing to the high consumer awareness, aggressive brand competition, and deep integration of energy drinks into daily lifestyles. According to the U.S. Bureau of Labor Statistics, the average American worker spends 8.8 hours per day on work-related activities, fostering reliance on stimulants for sustained performance. Additionally, the fitness and gaming sectors amplify consumption; the International Health, Racquet & Sportsclub Association reported that 57 million Americans were gym members in 2023, many of whom use energy drinks pre-workout. Regulatory clarity and established distribution networks ensure consistent product availability, reinforcing market stability and growth.
Europe Energy Drinks Market Analysis
Europe was positioned next with 28.7% of the global energy drinks market in 2025. Countries like the United Kingdom, Germany, and Austria exhibit high brand loyalty and early adoption of functional variants. As per the European Federation of Beverage Industries, energy drink sales grew by 5.1% in 2022 despite regulatory scrutiny by innovation in sugar-free and organic formulations. The region’s extensive night-time economy in cities like Berlin and London, sustains demand among shift workers and nightlife participants. As per European Environment Agency, over 12 million people are employed in 24-hour service sectors, creating a steady consumer base.
Asia Pacific Energy Drinks Market Analysis
Asia Pacific (APAC) energy drinks market growth is esteemed to grow with an . Driven by urbanization and youth demographics, countries like India, Indonesia, and Vietnam are expanding rapidly. In Thailand, the Ministry of Public Health reported a 19% increase in energy drink consumption between 2020 and 2023, linked to rising motorcycle taxi and delivery gig work. Local brands such as Krating Daeng and Lipovitan dominate, while global players adapt formulations to regional tastes.
Latin America Energy Drinks Market Analysis
Latin America energy drinks market growth is likely to have growth opportunities in the next coming years. According to the International Labour Organization, over 30% of young workers in Brazil are engaged in gig or delivery jobs, where energy drinks are commonly consumed to endure long hours. In Mexico, the National Institute of Statistics and Geography recorded a 16% rise in energy drink sales in 2022, driven by urban youth and nightlife consumption.
Middle East and Africa Energy Drinks Market Analysis
Middle East and Africa (MEA) energy drinks market is growing at steady pace during the forecast period with the expatriate populations, construction booms, and extreme climatic conditions that increase fatigue. As per the Gulf Labour Markets and Migration report, over 27 million migrant workers in the GCC countries work in physically demanding roles, creating demand for energy-boosting beverages.
COMPETITIVE LANDSCAPE
KEY MARKET PLAYERS
Some of the notable key players in the global energy drinks market are
-
Red Bull
-
Taisho Pharmaceutical Co. Ltd.
-
PepsiCo Inc.
-
Monster Energy
-
Lucozade
-
The Coca-Cola Company
-
Amway
-
AriZona Beverages USA
-
Living Essentials LLC
-
Xyience Energy
TOP STRATEGIES USED BY THE KEY MARKET PLAYERS
Key players in the energy drinks market employ a range of strategic initiatives to consolidate their positions and drive growth. Product innovation remains a central focus, with companies launching sugar-free, organic, and functional variants to meet evolving health preferences. Major brands are investing heavily in digital marketing and influencer collaborations to engage younger consumers on social media and gaming platforms. Strategic partnerships with beverage distributors those with established cold chain networks to enhance retail penetration in both urban and remote regions. Companies are also expanding into adjacent categories such as ready-to-drink coffee and sports hydration to diversify portfolios. Sustainability initiatives, including recyclable packaging and carbon footprint reduction, are increasingly used to strengthen brand image. Additionally, experiential marketing through sports, music, and esports sponsorships helps build emotional connections with consumers.
COMPETITION OVERVIEW
The competition in the energy drinks market is intense, characterized by aggressive branding, rapid innovation, and strategic alliances among global and regional players. Multinational corporations such as Red Bull and Monster leverage extensive distribution networks and high-impact marketing to maintain visibility, while local brands like Krating Daeng and Lipovitan D capitalize on cultural familiarity and pricing advantages. The market is witnessing a shift from volume-driven growth to value-based differentiation, with companies introducing premium, functional, and health-oriented variants to stand out. Digital engagement has become a battleground, as brands invest in social media, esports, and influencer marketing to capture younger demographics. Mergers, acquisitions, and joint ventures are increasingly common, enabling faster market entry and enhanced logistics. Regulatory pressures around sugar content and caffeine labeling have forced reformulations by leveling the playing field for smaller innovators. Price competition remains moderate due to brand loyalty, but discounting is prevalent in emerging markets. Private-label entries are still limited, preserving dominance by established names.
TOP PLAYERS IN THE MARKET
- Red Bull GmbH has a dominant position in the Asia Pacific energy drinks market through strategic localization and aggressive experiential marketing. The company has tailored its product offerings to regional preferences, introducing smaller can sizes and lower-sugar variants in markets like Thailand and India. Red Bull actively sponsors extreme sports, music festivals, and esports events across Japan, Australia, and Southeast Asia, reinforcing brand visibility among youth. In 2023, it launched Red Bull Campus Cricketers in India, targeting college-level athletes to deepen engagement with younger demographics. The company also invested in cold chain infrastructure in Indonesia and the Philippines to enhance distribution efficiency in remote areas.
- Monster Beverage Corporation has intensified its presence in Asia Pacific by forging exclusive distribution partnerships and expanding its product portfolio to include functional variants. The company leveraged its alliance with Coca-Cola, which handles distribution in several key markets, to improve shelf availability in convenience stores and supermarkets across Australia, South Korea, and Vietnam. In 2022, Monster introduced Monster Ultra Sunrise and Rebel Energy in India, catering to health-conscious consumers seeking zero-sugar options. It also launched targeted digital campaigns using social media influencers and gaming collaborations to appeal to millennials and Gen Z. Additionally, the company increased its sponsorship of motorsports and music events in Japan and New Zealand.
- Osotspa Public Company Limited (Krating Daeng) is a pioneering force in the Asia Pacific energy drinks market, originating the category in Thailand in 1972. The brand’s deep cultural roots have enabled it to maintain strong consumer trust and loyalty across Southeast Asia. Osotspa has expanded Krating Daeng’s distribution to over 40 countries, with significant penetration in Laos, Cambodia, and Myanmar. In 2023, the company launched a new eco-friendly packaging initiative, introducing recyclable aluminum cans and reducing plastic use by 18% across its production lines. It also partnered with ride-hailing platforms in Thailand to distribute samples to drivers, targeting gig economy workers.
RECENT HAPPENINGS IN THE MARKET
- In March 2023, Red Bull launched a regional esports league across Southeast Asia, which is partnering with local gaming platforms to engage youth and expand digital brand presence in high-growth markets.
- In August 2022, Monster Beverage Corporation introduced Monster Ultra Paradise and Ultra Zero in India by expanding its zero-sugar lineup to cater to health-conscious consumers amid rising diabetes concerns.
- In January 2025, Osotspa Public Company Limited inaugurated a new production facility in Chonburi, Thailand by increasing its annual energy drink output by 30% to meet rising regional demand.
- In November 2023, Coca-Cola Japan launched Lift Plus, a new energy drink fortified with B-vitamins and ginseng, which is targeting office workers and students during peak academic and business seasons.
- In June 2022, V Energy Drinks, owned by Frucor Suntory, rebranded its packaging in Australia and New Zealand with bolder visuals and improved recyclability to enhance shelf appeal and sustainability perception.
MARKET SEGMENTATION
This research report on the global energy drinks market has been segmented and sub-segmented based on product, type, consumption, distribution channel and region.
By Type
- Alcoholic
- Non-alcoholic
By Packaging
- Cans
- Bottles
By End User
- Kids
- Adults
- Teenagers
By Region
- North America
- Europe
- Asia-Pacific
- Latin America
- Middle East and Africa
Frequently Asked Questions
1. What is the global energy drinks market?
The global energy drinks market includes beverages designed to boost energy, alertness, and physical performance.
2. What is driving the growth of the global energy drinks market?
Growing urbanization, busy lifestyles, and demand for functional beverages are driving the global energy drinks market.
3. What is the expected CAGR of the global energy drinks market?
The global energy drinks market is expected to grow at a strong CAGR due to rising consumption worldwide.
4. Which regions are leading the global energy drinks market?
North America and Europe are currently leading the global energy drinks market, with Asia-Pacific growing rapidly.
5. What are the major product types in the global energy drinks market?
Sugar-free, organic, and flavored energy drinks are key segments in the global energy drinks market.
6. Who are the key players in the global energy drinks market?
Leading companies in the global energy drinks market include Red Bull, Monster Beverage, Rockstar, and PepsiCo.
7. How is the global energy drinks market responding to health concerns?
Brands in the global energy drinks market are offering low-calorie, organic, and natural ingredient-based options.
8. What distribution channels dominate the global energy drinks market?
Retail stores, convenience stores, and online platforms are key sales channels in the global energy drinks market.
9. How do marketing and sponsorship impact the global energy drinks market?
Aggressive branding and sports sponsorships significantly boost visibility in the global energy drinks market.
10. What challenges are faced by the global energy drinks market?
Health-related regulations and increasing scrutiny on caffeine levels pose challenges to the global energy drinks market.
Related Reports
Access the study in MULTIPLE FORMATS
Purchase options starting from
$ 2500
Didn’t find what you’re looking for?
TALK TO OUR ANALYST TEAM
Need something within your budget?
NO WORRIES! WE GOT YOU COVERED!
Call us on: +1 888 702 9696 (U.S Toll Free)
Write to us: sales@marketdataforecast.com